FOCUS ON: Hawkish Comments At Jackson Hole Symposium Trigger Market Sell-Off
- Risk-off sentiment returns to the markets after Jerome Powell’s warnings at Jackson Hole Symposium
- Dollar strength points to GBPUSD and EURUSD continuing to come under pressure
- Friday’s US Non-Farm Payroll jobs numbers due on Friday are the next big data point to watch out for
The risk that the Jackson Hole Economic Symposium could derail the markets became a reality at the end of last week as Jerome Powell of the US Federal Reserve issued a stark warning for investors. His hawkish guidance on US interest rates caused a massive uptick in price volatility and a sell-off in risk-on assets, as his comments underlined, once again, that 2022 is not a time for investors to fight the Fed.
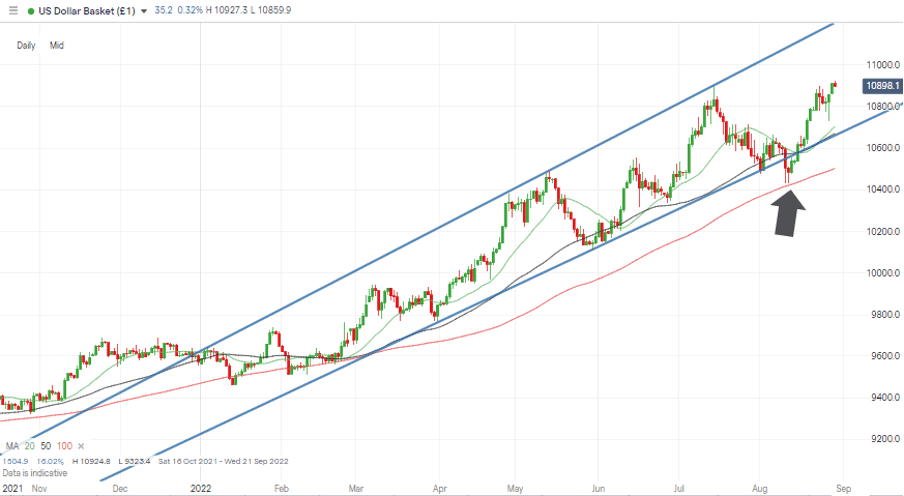
GBPUSD and EURUSD have, on a week-to-week basis, given up close to 1% in value against the US dollar, -1.20% and -0.83%, respectively. A signal that there could be a significant overhaul in sentiment came from the sometimes relatively low volatility dollar-yen market. The dollar strengthened against the yen by 1.48% over the week.
Jerome Powell’s comments that US households will endure “some pain” (source: Federal Reserve) in the coming months acted as a catalyst for euro, sterling, and stock market prices to tumble. The metrics and indicators that go up to make the week’s technical matrix have, as a result, taken on a distinctly bearish tone and this week are packed full of ‘Strong Sell’ signals. Crude oil is the one outlier, with that market posting ‘Buy’ signals thanks to the continuing stand-off between Russia, OPEC, and the West regarding production levels.
US Dollar Basket Chart – Daily Candles – Price Trading Mid-Channel
Source: IG
German and Eurozone consumer inflation reports will be released on Tuesday 30th and Wednesday 31st August. However, as the week progresses, trading floors will be turning their attention to the US Non-Farm Payroll jobs numbers due out on Friday 2nd September. That key data point of the month could offer a glimmer of hope to investors, and there is always potential to call the bottom of the market and average into positions in the build-up to that data release. However, until something triggers a change in sentiment, the path of least resistance for risk assets continues to appear downward. Powell’s view that the current situation “requires using our tools forcefully to bring demand and supply into better balance” (source: Federal Reserve) provides a stark backdrop to the coming week.
Instrument | Price | Hourly | Daily |
EUR/USD | 0.9936 | Strong Sell | Strong Sell |
GBP/USD | 1.1668 | Strong Sell | Strong Sell |
USD/JPY | 138.82 | Strong Buy | Strong Buy |
S&P 500 | 4,035 | Strong Sell | Strong Sell |
NASDAQ 100 | 12,464 | Strong Sell | Strong Sell |
FTSE100 | 7,377 | Strong Sell | Sell |
Gold | 1,724 | Strong Sell | Strong Sell |
Crude Oil WTI | 93.36 | Buy | Buy |
Bitcoin | 19,801 | Strong Sell | Strong Sell |
Ethereum | 1,449 | Strong Sell | Strong Sell |
UTC: 08:22
Our trading signal analysis is based on a comprehensive summary of market data. We use a range of metrics with weighting given to simple and exponential moving averages and key technical indicators.
We created this Weekly Tips section to share possible trade entry and exit points based on our technical analysis. We also have other methods to validate our trades which we can’t publicly share that help to increase their success. All our trades include entry and at least one target price. Stop losses are applied at the reader’s discretion. Our strategies typically trade with a wide stop loss, and risk is further mitigated by trading in small sizes.
Forex
GBPUSD
This week is a quiet one in terms of UK economic reports. Cable traders are therefore left mulling the last Consumer Price Index (CPI) data released on Wednesday 17th August that indicated UK inflation is a long way from topping out.
Double-digit inflation in an economy would typically result in a currency showing strength due to the need for central banks like the Bank of England to step in and raise interest rates. Sterling’s price fall from 1.2143 in mid-August to 1.1674 currently bucked that trend thanks to the more aggressive policy of the US Fed overshadowing the actions of the Bank, which continues to be accused of doing too little, too late. The next UK interest rate announcement isn’t due until 15th September 2022, which leaves plenty of time for the price of GBPUSD to continue to soften.
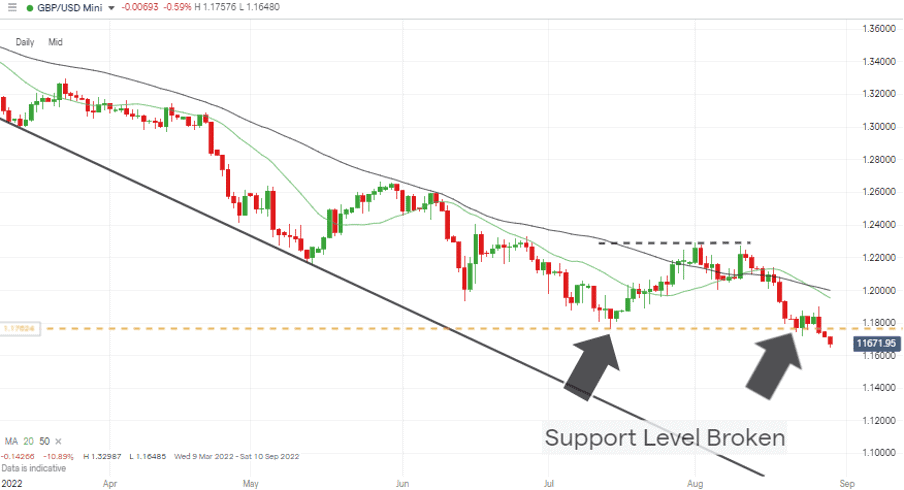
GBPUSD Chart – Daily Candles – Break of Support Level
Source: IG
Before the Jackson Hole statements, GBPUSD had consolidated at the support level of 1.176, which had marked the year-to-date low for cable. Powell’s comments were enough to send GBPUSD tumbling through the 1.176 marker, which now acts as a resistance level should price experience a short-term reversal.
The Technical Analysis and Trading Ideas Report of 22nd August identified opportunities to trade short using scalping and breakout. However, with price continuing to slide, those looking to sell GBPUSD are left trying to build into the downward momentum or applying some patience and waiting for a pullback to 1.176.
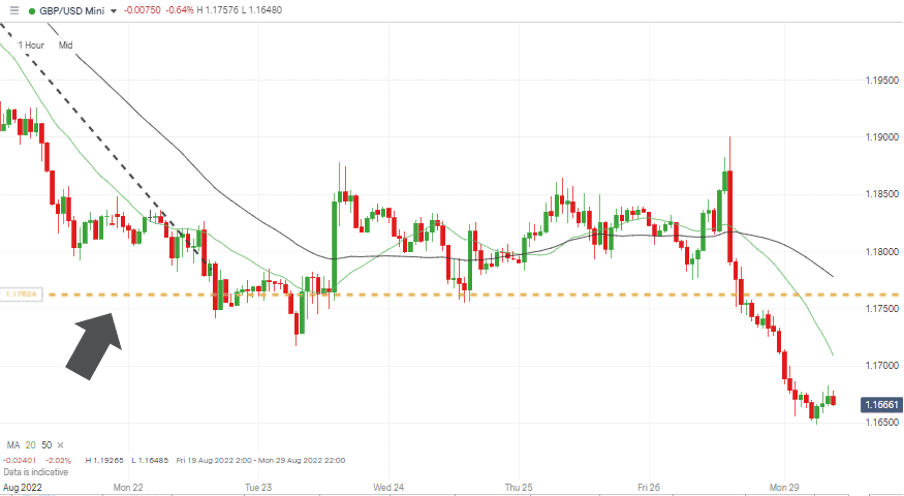
GBPUSD Chart – Hourly Candles – Continued Bearish Price Action
Source: IG
With price already on a downward roll, traders looking to add short positions face the quandary of whether to wait until the 1.176 support level is tested before putting on positions. Assuming that at least a kiss of that level is inevitable opens the door to a scalping style opportunity. Still, a break of the level would suggest a longer-term breakout strategy needs to be applied.
Short positions
- Entry Level 1: 1.1760 – Price low of 14th July 2022. Previously acted as support and now as resistance. Sell into short-term strength.
- Price Target 1: 1.1650 – Intraday price low of 29th August 2022.
- Price Target 2: 1.14098 – Price low of March 2020.
- Stop Loss: > 1.17781 – Region of the 100 SMA on the Hourly Price Chart.
Long positions
- Entry Level 1: 1.1760 – A breakthrough of 1.1760 would be a significant move considering its influence on price during the week starting 22nd August.
- Price Target 1: 1.1873 – Region of short-term downward trendline dating back to February 2022.
- Price Target 2: 1.2000 – Psychologically important price level.
- Stop Loss: < 1.1650 – Intraday price low of 29th August 2022.
EURUSD
Consumer Price Index numbers for Germany and the Eurozone are due out midweek. Given the ECB’s reluctance to hike rates in the first half of 2022, the data in that report could make for grim reading. If inflation comes in ahead of forecasts, then the ECB will be faced with the dilemma of prioritising the stabilising of prices or tipping the zone into a recession just as a winter of uncertain gas supplies comes into view.
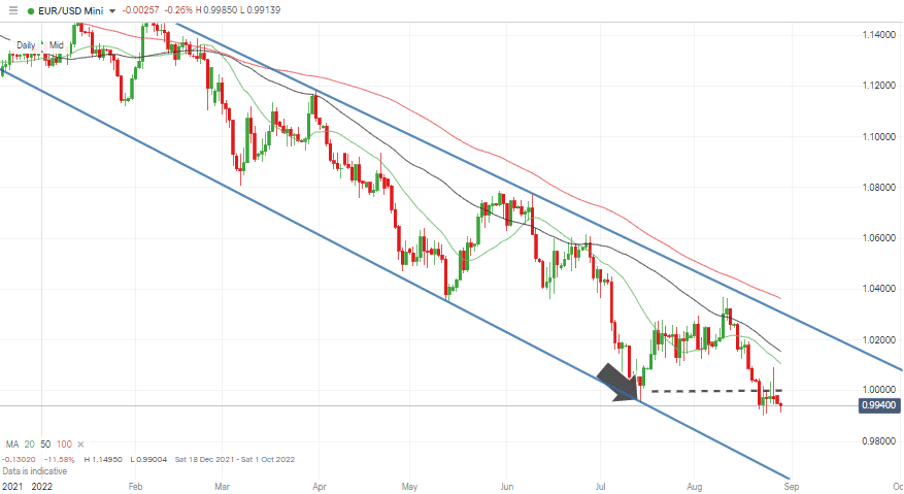
EURUSD Chart – Daily Candles – Long-term Downtrend
Source: IG
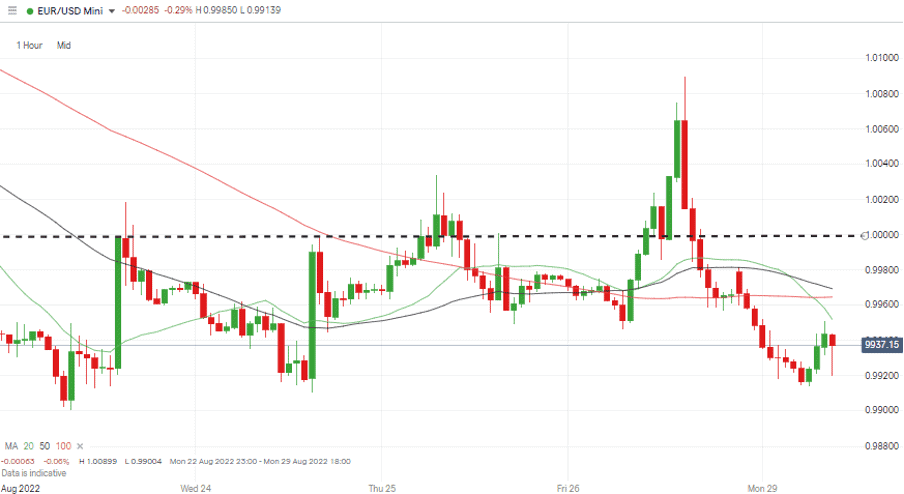
The ‘big number’ to watch is 1.000, with the move to below parity on Monday 22nd August being followed by price consolidation around that major support/resistance level.
EURUSD Chart – Hourly Candles – Trading Below Parity
Source: IG
Short positions
- Entry Level 1: 1.0000 – Selling into short-term strength using a pullback trading strategy.
- Price Target 1: 0.99004 – Price low of Monday 22nd August. Current year-to-date low.
- Price Target 2: 0.96530 – Supporting trendline of downward price channel dating back to March 2022.
- Stop Loss: > 1.01053 – Region of the 20 SMA on the Daily Price Chart.
Long positions
- Entry Level 1: 1.0000 – A breakout strategy based on buying pressure coming into the market at the hugely significant parity price level.
- Price Target 1: 1.01602 – 50% Fibonacci retracement of the price rally from 14th July to 10th August 2022.
- Stop Loss: < 0.99004 – Current year-to-date low.
Indices
NASDAQ 100
Major US equity indices fell sharply following Powell’s confirmation that the Fed’s policy will remain hawkish for the foreseeable future. The growth stock dominated Nasdaq 100 index suffered the brunt of the blow and dropped more than 4% in Friday’s session.
With earnings season virtually completed, few corporate announcements are in the pipeline to act as a catalyst for an upward move. That leaves the Non-Farm Payroll numbers on Friday 2nd September taking centre stage for equity traders.
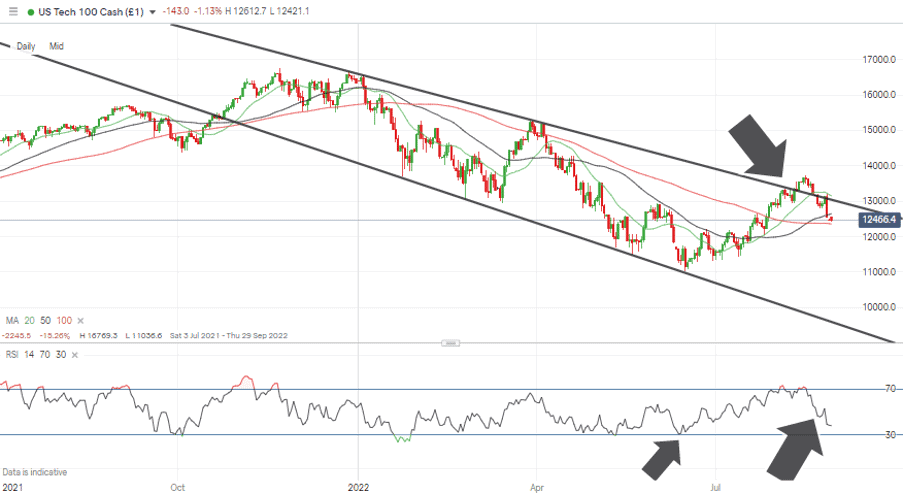
NASDAQ 100 Chart – Daily Candles – Daily RSI at 38.19
Source: IG
No one can be certain when the stock market will bottom out, which leaves high-profile market gurus forming two camps – one stating that the market is about to bounce and another that it will continue falling. Predicting short-term moves is also tricky due to the Daily RSI on the Daily Price Chart sitting at 38.19, which suggests that despite the recent sell-off, the index is still some way from being oversold.
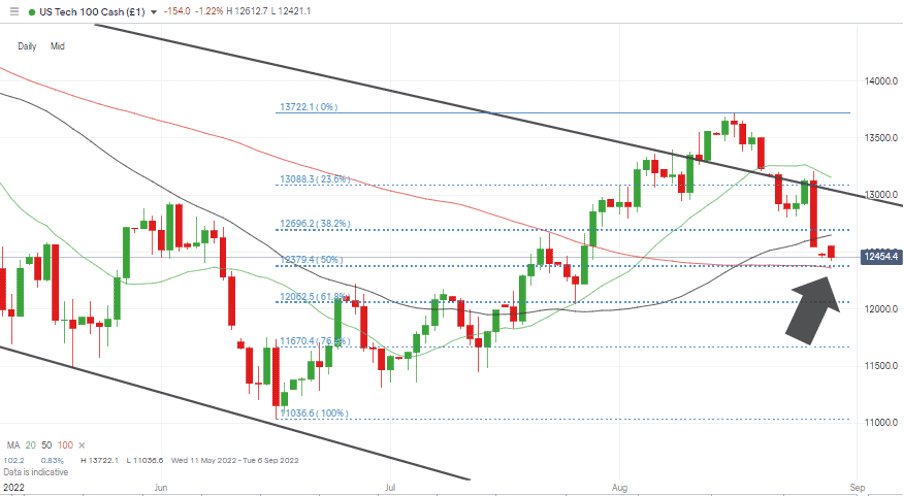
NASDAQ 100 Chart – Daily Candles – Fib Retracement and 100 SMA Converge
Source: IG
Long positions
- Entry Level 1: 12,379 – 50% Fib retracement of the relief rally, which occurred between 16th June and 15th August. Also, in the region of the 100 SMA on the Daily Price Chart (12,362).
- Price Target 1: 13,722 – Price high of 16th August 2022.
- Price Target 1: 14,000 – Round number resistance and just below the 20 SMA on the Monthly Price Chart (14,063).
- Stop Loss: < 12,052 – 61.8% retracement of the June-July-August rally and close to the psychologically important 12,000 round number price level.
Short positions
- Entry Level 1: 13,008 – Selling into short-term strength. Region of the downward trendline of the price channel which dates back to December 2021. Also, round number resistance level.
- Price Target 1: 12,650 – Region of the 50 SMA on the Daily Price Chart.
- Stop Loss: >13,155 – Region of the 20 SMA on the Daily Price Chart.
Crypto – Bitcoin & Ethereum
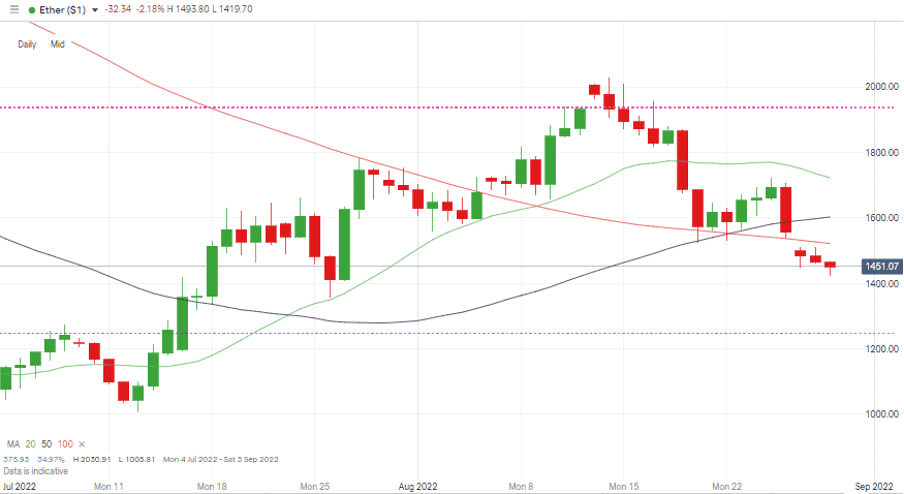
Cryptocurrencies posted another down week thanks to Powell’s promise of higher interest rates drying up the amount of cash available for speculative trades.
Ether’s price swings continue to be more aggressive than Bitcoin’s, and the move to ETH2.0 and The Merge remains the big story in the crypto market. The respective week-on-week price falls of 6.91% and 8.35% experienced by Bitcoin and Ether could have been worse considering the comments coming out of Jackson Hole, which suggests price is finding some support at current levels.
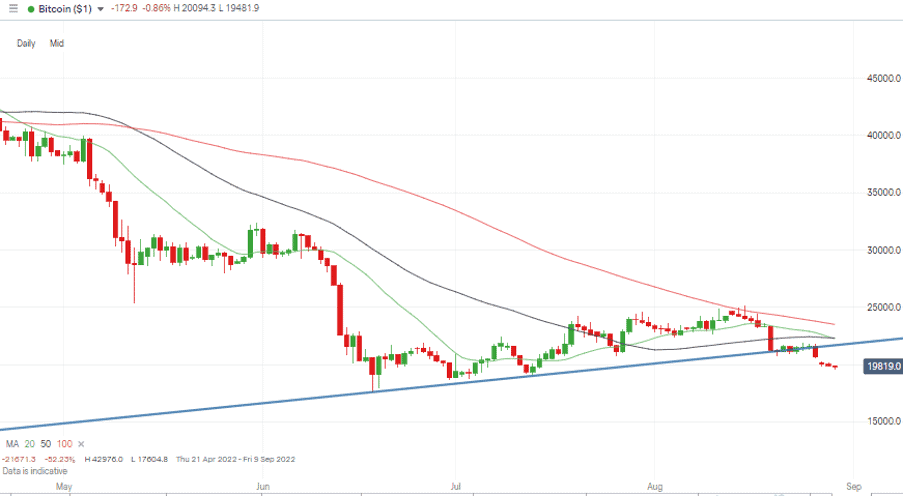
Bitcoin Price Chart – Daily Candles
Source: IG
Bitcoin Long positions
- Entry Level 1: 21,893 – Region of 50 SMA on Monthly Price Chart. Buying into price strength.
- Price Target 1: 21,228 – Trend line formed between 18th June and 19th August 2022. Previously acted as support and now represents resistance.
- Price Target 2: 23,514 – Region of 100 SMA on Daily Price Chart.
- Stop Losses: < 19,263 – Region of the 76.4% Fibonacci retracement which dates back to March 2020.
Ethereum
Ethereum Chart – Daily Candles
Source: IG
Ethereum Long positions
- Entry Level 1: 1,424– Intraday price low of Monday 29th August 2022.
- Price Target 1: 1,521 Region of the 100 SMA on the Daily Price Chart.
- Price Target 1: 1,938 – Fibonacci retracement resistance level and close to psychologically important 2,000 price level.
- Stop Losses: < 1,356 – Price low of 26th July 2022 and below the round number price level of $1,400
Risk Statement: Trading financial products carries a high risk to your capital, especially trading leverage products such as CFDs. They may not be suitable for everyone. Please make sure that you fully understand the risks. You should consider whether you can afford to take the risk of losing your money.
Forextraders' Broker of the Month
BlackBull Markets is a reliable and well-respected trading platform that provides its customers with high-quality access to a wide range of asset groups. The broker is headquartered in New Zealand which explains why it has flown under the radar for a few years but it is a great broker that is now building a global following. The BlackBull Markets site is intuitive and easy to use, making it an ideal choice for beginners.
