FOCUS ON: US Dollar Reasserts Dominance After Buoyant Jobs Data Released
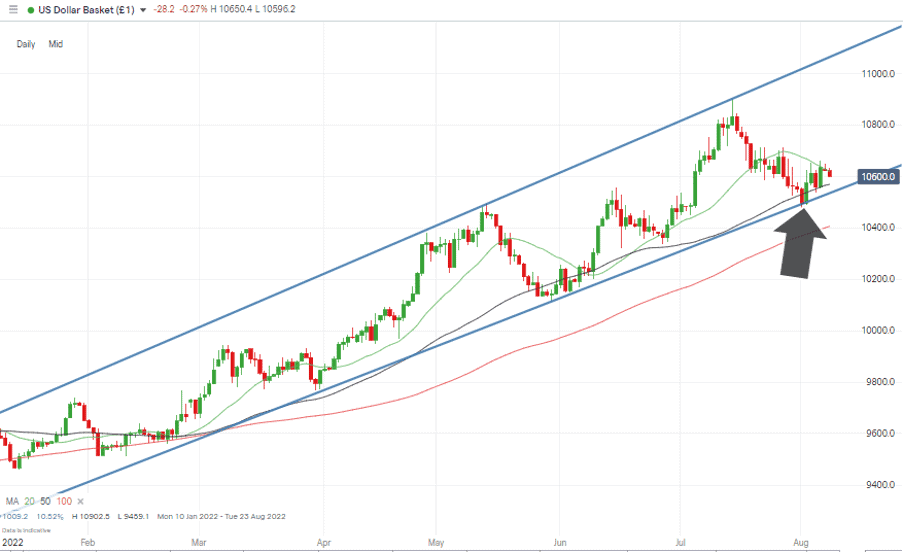
The US Non-Farm Payrolls unemployment data released on Friday has planted a very notable stick in the ground for forex traders. The number of new jobs created (528,000) far exceeded analyst expectations (Bloomberg survey, 325,000), and unemployment ticked down to 3.5% in July compared to 3.6% in June.
Another 75-basis-point US interest rate hike now looks increasingly likely when the Fed meets in September. The probability of that was reported by the CME FedWatch tracker shifting up from 50% to 70.5% in the space of a week. The decision by Jerome Powell and his colleagues to put through a 0.75% rate increase in June was at the time ground-breaking, but the additional 0.75% rise in July shows that the Fed now has a taste for its new approach, and inflation is firmly in its sights.
Doves can still claim that a loosening of monetary policy could be on the cards later in the year. The short-sharp-shock approach makes this even more likely. However, the stellar jobs report undoes a lot of the reports of doom and gloom that followed the announcement in July that the US economy had technically fallen into a recession. Two quarters of contracting GDP does meet the standard requirements for most economists to state that a recession has started, but the jobs market buoyancy reduces the need for the Fed to factor in the requirement for lower rates to mitigate the impact of lay-offs.
US Dollar Basket Chart – Daily Candles – Key SMAs Converging
Source: IG
Last week’s Technical Analysis and Trading Ideas Report was weighted towards the relief rallies in GBPUSD and EURUSD coming to an end. As it turns out, those calls were correct, but choppier trading could well be likely in the short term. The central banks of the UK and eurozone both increased their own interest rate levels by 0.50% at their last meetings, but while those were significant moments in their own right, it now appears likely that the Fed will put through a total of 2.25% of interest rate increases in the space of four months.
The key data releases in the coming week are the US Inflation numbers due on Thursday 11th August and UK GDP figures on Friday 12th August.
Instrument | Price | Hourly | Daily |
EUR/USD | 1.0184 | Neutral | Strong Sell |
GBP/USD | 1.2081 | Neutral | Strong Sell |
USD/JPY | 135.23 | Strong Buy | Strong Buy |
S&P 500 | 4,146 | Strong Buy | Strong Buy |
NASDAQ 100 | 13,231 | Neutral | Strong Buy |
FTSE100 | 7,464 | Strong Buy | Strong Buy |
Gold | 1,733 | Strong Sell | Neutral |
Crude Oil WTI | 89.04 | Strong Buy | Strong Sell |
Bitcoin | 23,534 | Strong Buy | Sell |
Ethereum | 1,728 | Strong Buy | Sell |
UTC: 08:05
Our trading signal analysis is based on a comprehensive summary of market data. We use a range of metrics with weighting given to simple and exponential moving averages and key technical indicators.
We created this Weekly Tips section to share possible trade entry and exit points based on our technical analysis. We also have other methods to validate our trades that we can’t publicly share that help to increase their success. All of our trades include entry and at least one target price. Stop losses are applied at the reader’s discretion. Our strategies typically trade with a wide stop loss, and risk is further mitigated by trading in small size.
Forex
GBPUSD
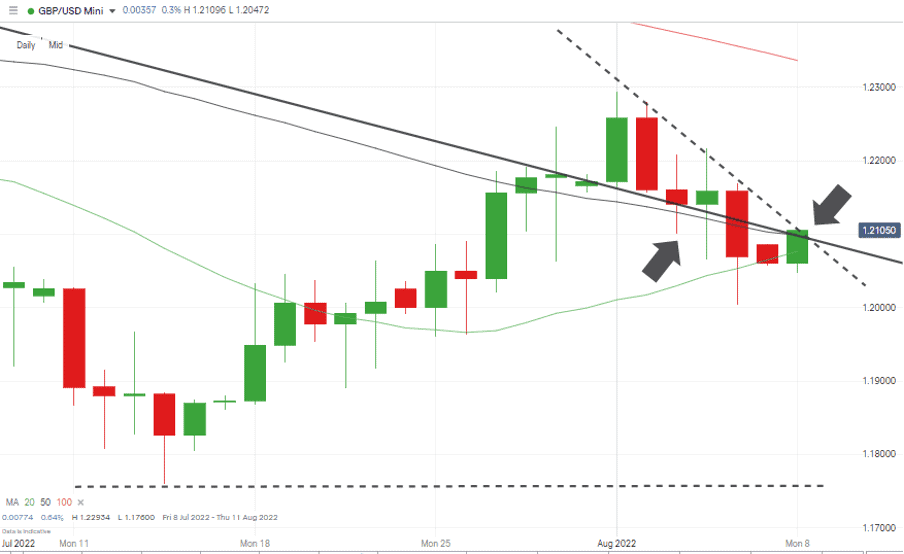
The UK inflation data due out on Thursday continues to appear more and more significant to the prospects of the GBPUSD currency pair. The Bank of England was only a matter of months ago adopting the line that inflation was “transitory”, but now forecasts that RPI could reach 13% in Q4. That kind of price pressure is well above the Bank’s target rate, and there is a feeling that the Governor and his team have lost the confidence of London dealing desks.
GBPUSD Chart – Daily Candles – SMA and Trendline
Source: IG
Inadequate action by the Bank has even resulted in candidates for the leadership of the Conservative Party campaigning on a basis of reforming the Bank’s mandate. The Monetary Committee voted 8-1 last week to raise interest rates by 0.50%, but compared to US policy, it still appears too little, too late.
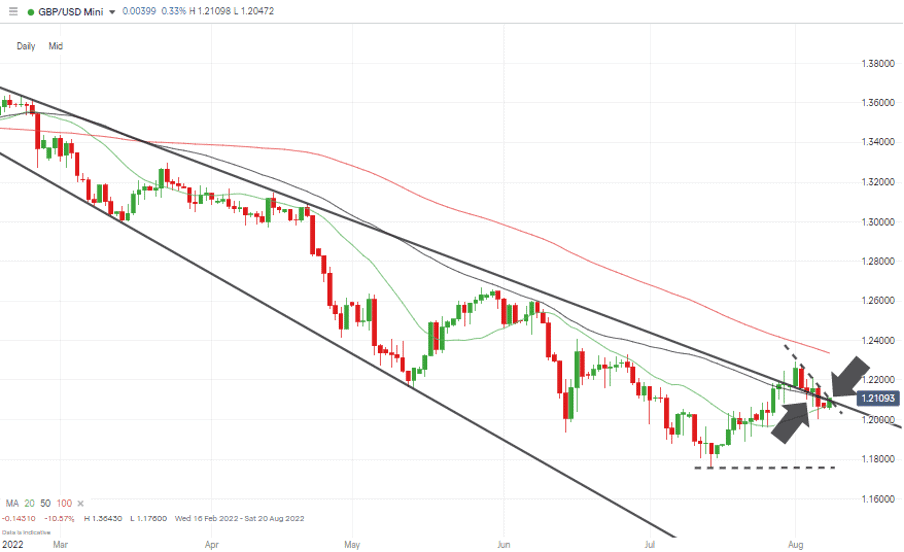
GBPUSD Chart – Daily Candles – Long-Term Decline
Source: IG
Price volatility could taper off this week in the build-up to the UK GDP data announcement on Thursday. It’s also hard to make a committed call from a technical perspective – cable is currently trading in close proximity to the downwards resistance trendline of a multi-month price channel, but on the other hand, also sits above the 50 SMA on the Daily Price Chart.
Short positions
- Entry Level 1: 1.20768 – Region of 50 SMA on the Daily Price Chart. Also, region of trendline resistance-support.
- Price Target 1: 1.176 – Year-to-date price low of 14th July 2022.
- Stop Loss: > 1.22934 – Month-to-date price high printed on Monday 1st August.
Long positions
Entry Level 1: 1.20768 – Buying into any short-term price weakness with a view that the breakout of mid-July has further upwards momentum.
- Price Target 1: 1.22934 – Month-to-date price high printed on Monday 1st August.
- Price Target 2: 1.23365 – Region of the 100 SMA on the Daily Price Chart.
- Stop Loss: < 1.2077 – Region of the 20 SMA on the Daily Price Chart and the area of the psychologically important 1.20 price level.
EURUSD
The euro fared better than GBPUSD last week. EURUSD was down 0.25% compared to cable’s 0.79% slide in value.
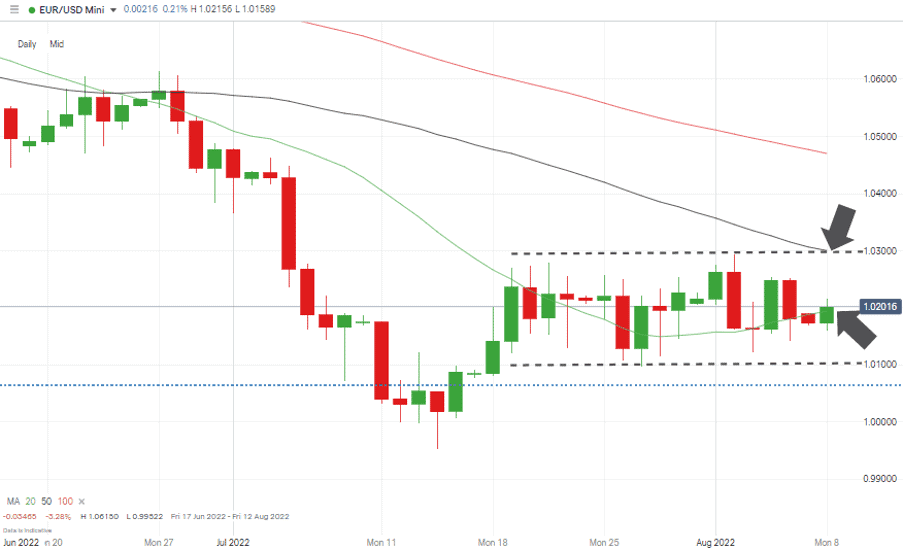
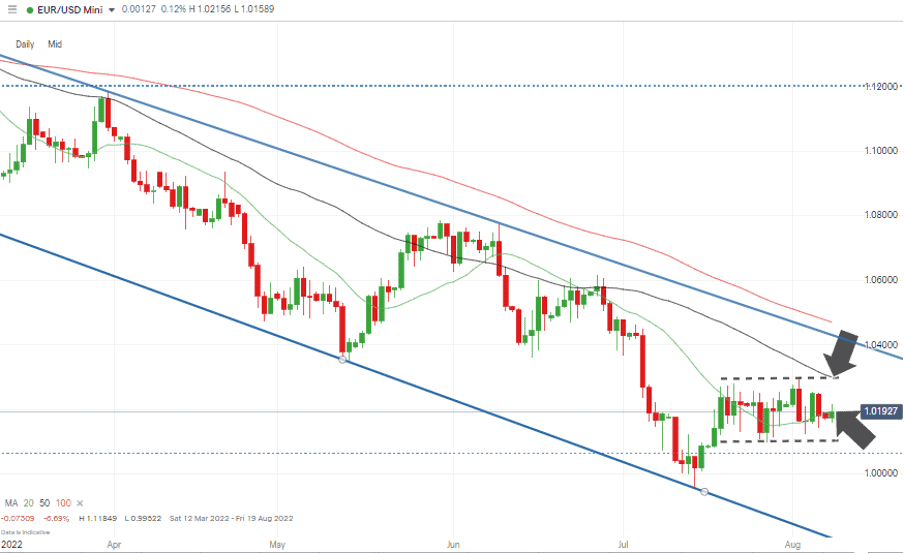
This has set up a sideways trading channel that dates back to 19th July, and for the immediate future appears to be the dominant technical indicator.
EURUSD Chart – Monthly Candles – Short-Term Sideways Trading Pattern
Source: IG
The coming week is light in terms of EURUSD-related news announcements, which leaves the energy supply concerns and Ukraine-Russia political dynamics as the most likely catalysts for any potential breakout. Even if the situation does ease, upwards movement in EURUSD would face stiff resistance in the region of 1.03, which is the upper end of the current channel, the region of the 50 SMA on the Daily Price Chart and a psychologically important ‘round number’ price level.
EURUSD Chart – Daily Candles – Long-Term Downwards Channel
Source: IG
Short positions
- Entry Level 1: 1.03 – Region of the 50 SMA on the Daily Price Chart, upper end of sideways pattern, and round number resistance.
- Price Target 1: 1.0009 – Price low of 27th July 2022, which marks bottom end of sideways trading channel.
- Price Target 2: 0.99522 – Year-to-date price low recorded on 14th July 2022 and region of potential triple-bottom on the Monthly Price Chart.
- Stop Loss: > 1.03 – Above the three key metrics that sit in the region of 1.03.
Long positions
- Entry Level 1: 1.0009 – Buying into any weakness that takes price to the lower region of the sideways channel. Price low of 27th July 2022.
- Price Target 1: 1.03 – Upper end of sideways channel.
- Stop Loss: < 1.0000 – Psychologically important price level.
Both short and long positions following the range-trading strategy could use the 20 SMA on the Daily Price Chart as a place to lock in profits. That SMA currently sits in the middle of the channel in the region of 1.019.
USDJPY
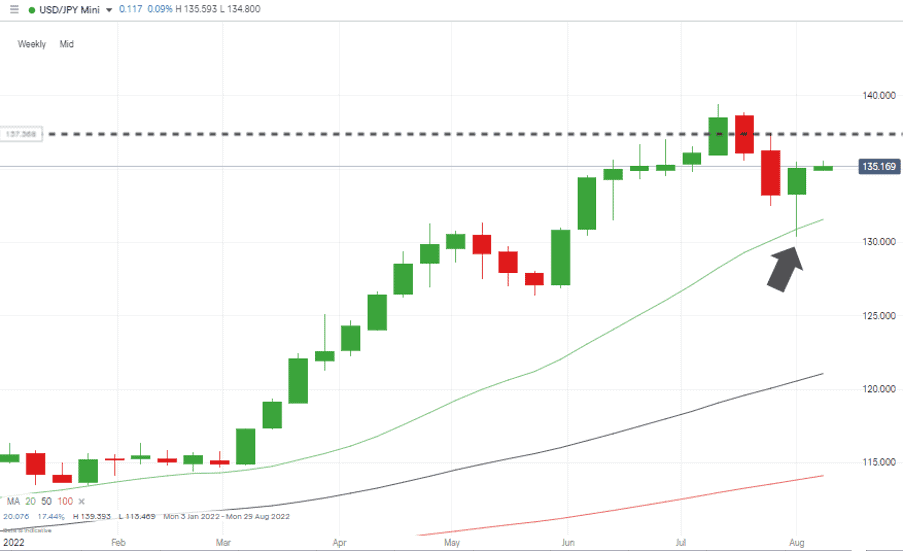
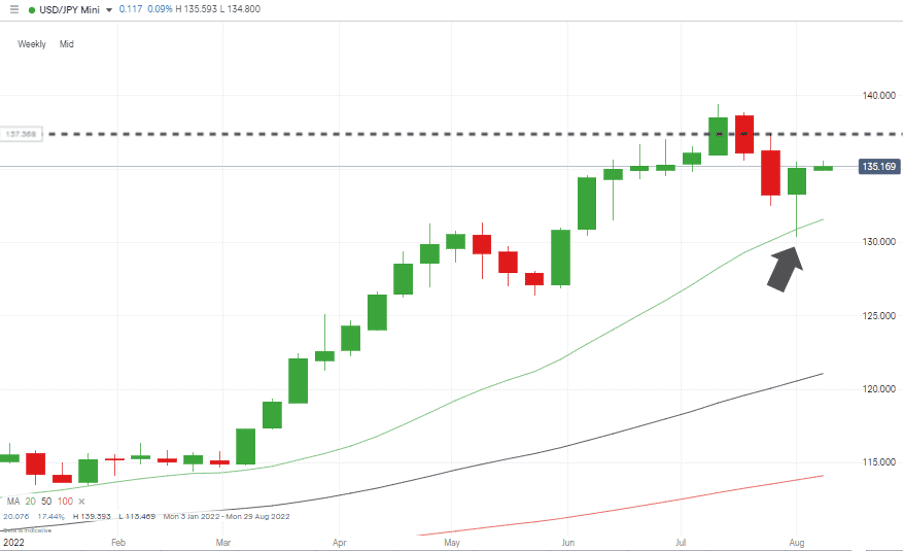
Last Monday’s down-day in USDJPY has all the trademarks of a market capitulation, and after that sell off, there is plenty of room for the currency pair to carry on rising to test July highs. Indicators in the Technical Analysis and Trading Ideas Report pointed towards the opportunity to buy into weakness, but the strength of the short-term sell-off surprised many.
USDJPY Chart – Daily Candles – Test of SMA
Source: IG
Price bottomed out on Tuesday 2nd August at 130.39, which represented an intraday extension past two key supporting indicators, the 100 SMA on the Daily Price Chart (132.45) and the 20 SMA on the Weekly Price Chart (130.91). The key 130.00 round-number price support was not tested and looks a good price level at which to set stop losses on long positions.
USDJPY Chart – Weekly Candles – Test of SMA
Source: IG
Long positions
- Entry Level 1: 135.67 – Applying a momentum based strategy to catch further upwards movement once price breaks through the 50 SMA on the Daily Price Chart.
- Price Target 1: 137.41 – Year to date price high printed on 14th July 2022.
- Stop Loss: < 130.00 – Psychologically important round number price support.
Short positions
- Entry Level 1: 135.51 – Region of the 20 SMA on the Daily Price Chart.
- Entry Level 2: 135.67 – Region of the 50 SMA on the Daily Price Chart.
- Price Target 1: 130.39 – Price low of last week. Exiting trades here avoids waiting for the ‘big number’ of 130.00 being reached before locking in profits.
- Stop Loss: > 140.00 – Round number price level.
Indices
NASDAQ 100
Major stock indices posted gains last week as earnings season continued to offer investors enough reasons to allocate cash which had been sitting on the side-lines. There was also a rotation into growth stocks and the Nasdaq 100 led the way and posted a 2.61% gain with the FTSE 100 and S&P 500 Index recording rises of 0.73% and 0.80%, respectively.
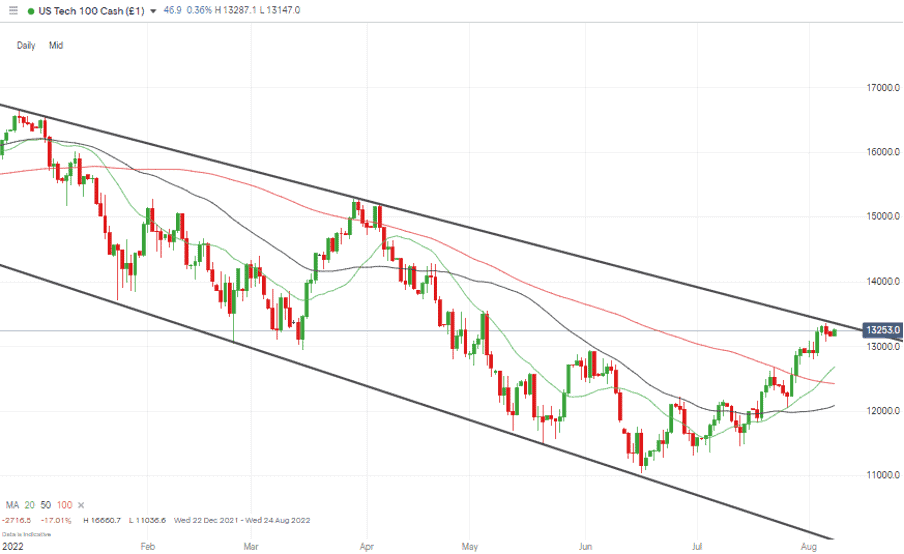
The price of the Nasdaq 100 now sits above all the key SMAs on the Daily Price Chart which means bullish momentum is confirmed, but the downwards trendline dating back to the start of 2022 is coming into play and could offer resistance.
NASDAQ 100 Chart – Daily Candles – 20 SMA Support
Source: IG
Long positions
- Entry Level 1: 13,342 – The path of least resistance continues to appear to be upwards but applying patience and waiting for a break of the trendline resistance could avoid the risk of getting caught in a bear-trap rally.
- Price Target 1: 14,000 – Round number resistance and just below the 20 SMA on the Monthly Price Chart (14,104).
- Stop Loss: < 12,683 – Region of the 20 SMA on the Daily Price Chart.
Crypto – Bitcoin & Ethereum
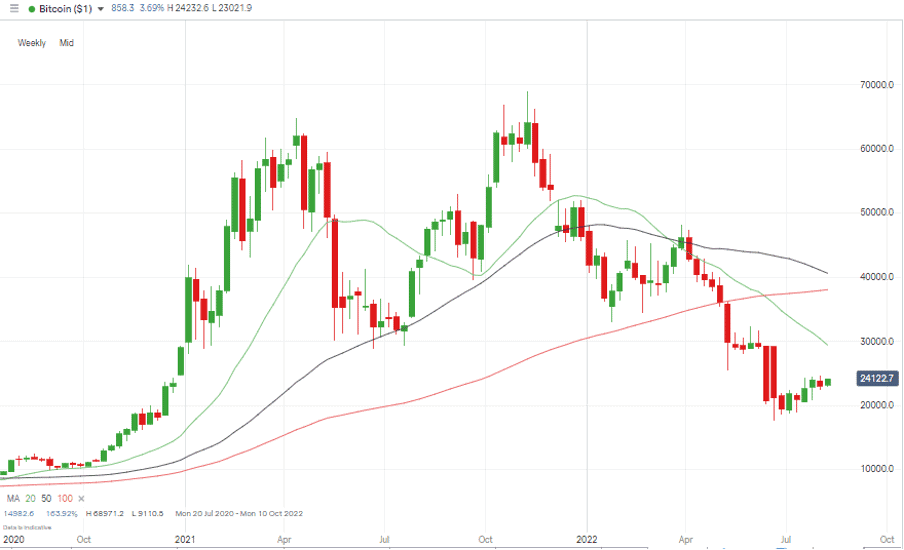
It was a better week for Altcoins than the two market leaders as bitcoin and ethereum saw volatility drain away and price consolidate. Ether’s prospects of finally completing The Merge and moving to more energy efficient Proof-of-Stake protocols continues to give it the edge. ETH rose by 2.73% on the week compared to 1.30% recorded by BTC.
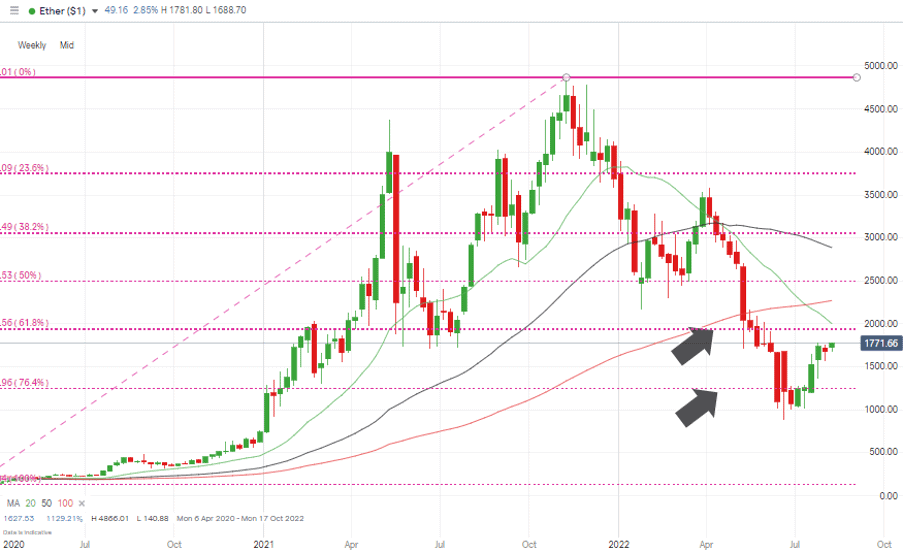
Ether’s impressive bounce off the 76.4% Fibonacci retracement support level in June has been followed by a doubling of value in the space of a few weeks, but price is beginning to close in on the 61.8% Fib support which could offer resistance in the region of 1,938.
Bitcoin Price Chart – Weekly Candles
Source: IG
Bitcoin Long positions
- Entry Level 1: 23,005 – Region of 20 SMA on Daily Price Chart.
- Price Target 1: 25,675 – Region of 100 SMA on Daily Price Chart.
- Stop Losses: < 19,263 – Region of the 76.4% Fibonacci retracement which dates back to March 2020.
Ethereum
Ethereum Chart – Weekly Candles – Fib Support Levels
Source: IG
Ethereum Long positions
- Entry Level 1: 1,658 – Buying into weakness and using 50 SMA on Daily Price Chart as a guide.
- Price Target 1: 1,938 – Fibonacci Retracement resistance level and close to psychologically important 2,000 price level.
- Stop Losses: < 1,626 – Region of 20 SMA on Daily Price Chart.
Risk Statement: Trading financial products carries a high risk to your capital, especially trading leverage products such as CFDs. They may not be suitable for everyone. Please make sure that you fully understand the risks. You should consider whether you can afford to take the risk of losing your money.
Forextraders' Broker of the Month
BlackBull Markets is a reliable and well-respected trading platform that provides its customers with high-quality access to a wide range of asset groups. The broker is headquartered in New Zealand which explains why it has flown under the radar for a few years but it is a great broker that is now building a global following. The BlackBull Markets site is intuitive and easy to use, making it an ideal choice for beginners.
