Instrument | Price | Hourly | Daily |
EUR/USD | 1.0416 | Neutral | Neutral |
GBP/USD | 1.2231 | Strong Buy | Buy |
USD/JPY | 129.39 | Sell | Sell |
S&P 500 | 4,007 | Sell | Strong Sell |
NASDAQ 100 | 12,296 | Neutral | Strong Sell |
FTSE100 | 7,418 | Strong Sell | Neutral |
Gold | 1,798 | Strong Buy | Strong Sell |
Crude Oil WTI | 107.79 | Strong Buy | Strong Buy |
Bitcoin | 29,672 | Strong Buy | Strong Sell |
Ethereum | 2,016 | Strong Buy | Strong Sell |
UTC 08:05
Our trading signal analysis is based on a comprehensive summary of market data. We use a range of metrics with weighting given to simple and exponential moving averages and key technical indicators.
We created this Weekly Tips section to share possible trade entry and exit points based on our technical analysis. We also have other methods to validate our trades which we can’t publicly share that help to increase their success. All our trades include entry and at least one target price. Stop losses are applied at the reader’s discretion. Our strategies typically trade with a wide stop loss, and risk is further mitigated by trading at small sizes.
The FTSE 100 equity index, the euro-dollar currency pair, and crypto market indicators are all pointing towards short-term strength and long-term weakness. Trading decisions need to be made with holding periods in mind, and choppy market conditions could prevail in the run-up to the Fed’s big announcement.
FOCUS ON: Potential For A Rally?
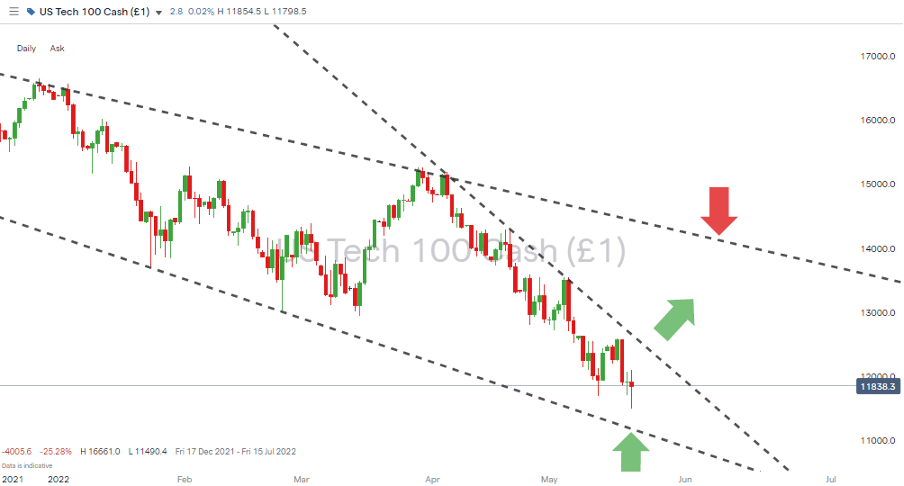
Those looking for signs that the markets might be oversold on a short-term time frame and ready for a bounce will note that the S&P 500 Index has posted seven down weeks in a row for the first time since 2001. Investors who suffered losses during the fallout from the dot-com crash will remember the sky-high and unsustainable valuations of the time and wonder if the economic fundamentals are as weak right now.
The late rally into Friday’s close prevented the equity market’s flagship index from closing in a bear market pattern which suggests some long-term bulls are looking to pick the bottom. For them, the coming week’s news releases could offer some respite due to a range of medium grade data releases.
The US Fed’s latest meeting minutes will be shared on Wednesday and are probably the most significant report of the week. Whilst important, that update isn’t on the same scale as the Fed’s announcement on rates, the Non-Farm Payrolls, or GDP figures. If prices of risk-on assets can find a base at their current levels, then even a hint of positive news could be enough of a catalyst to trigger a relief rally.
S&P 500 Index Price Chart – 1Day Candles – 2021 – 2022 – Falling Wedge Pattern – Breakout?
Source: IG
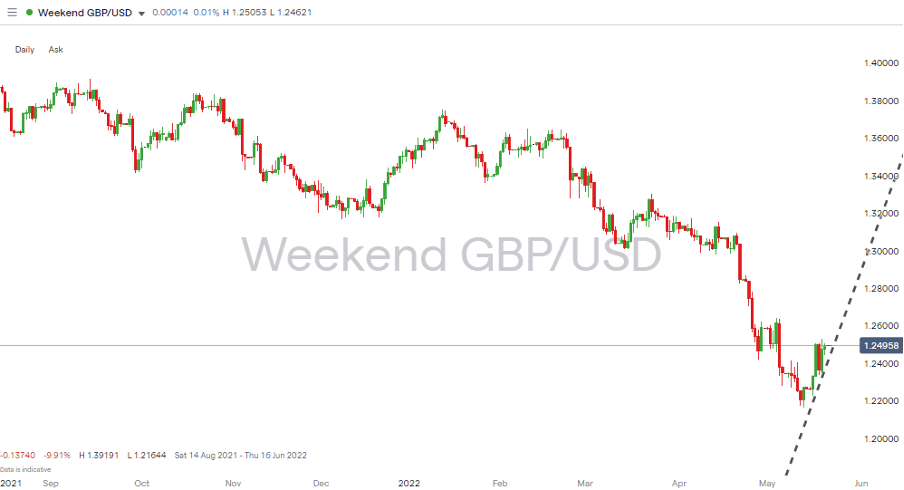
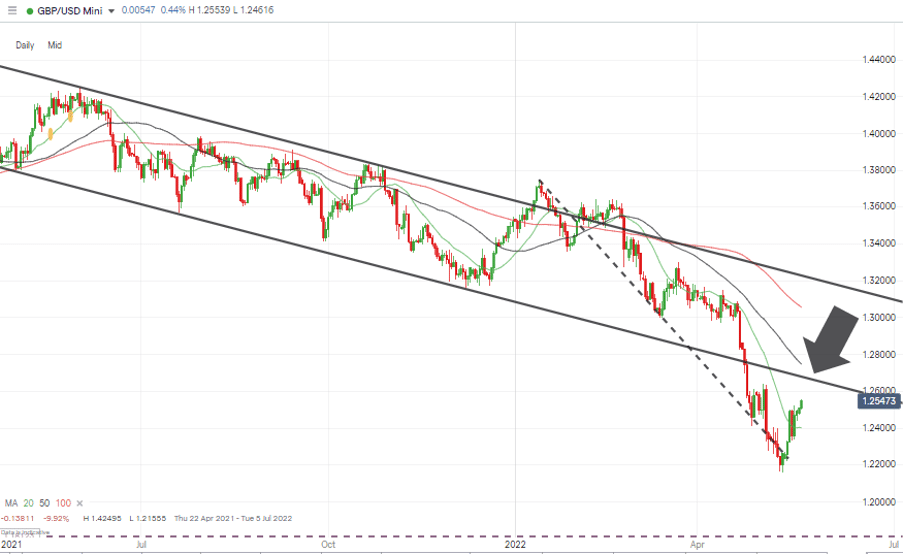
Last week the forex markets demonstrated how long-term weakness could accommodate short-term retracements. GBPUSD was a prime example. The currency pair has been showing weakness for several weeks but finally found some relief on Monday 16th May and ended the week up by 2.01%. Further upward price movement looks likely, but two key resistance levels are coming into play.
GBPUSD Price Chart – 1Day Candles – 2021 – 2022 – Dead Cat Bounce
Source: IG
Indices
NASDAQ 100
The RSI on the Nasdaq Daily Price Chart sits at 38.9, which doesn’t point to the market being massively oversold on that time frame, but the Nasdaq has posted seven down weeks in a row, and all trends come to an end.
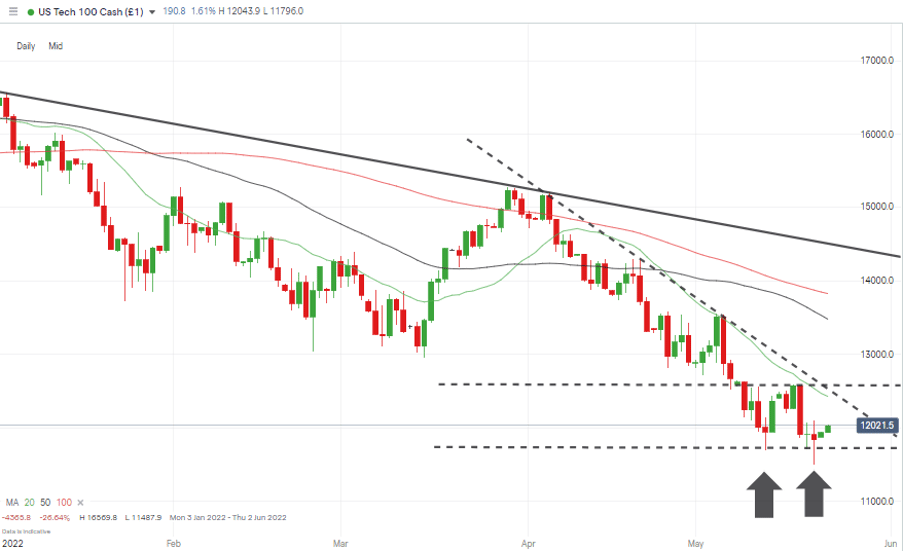
The gradient of the most recent downward trend line reflects the aggressive nature of the recent sell-off and now sits in the region of the 20 SMA on the Daily Price Chart. Those two key metrics could act as a magnet for price. Any break above 12,570 would point to a double-bottom pattern having been formed on 12th and 20th May 2022, which would change the landscape completely.
NASDAQ 100 Chart – 1Day Candles – Double Bottom Forming?
Source: IG
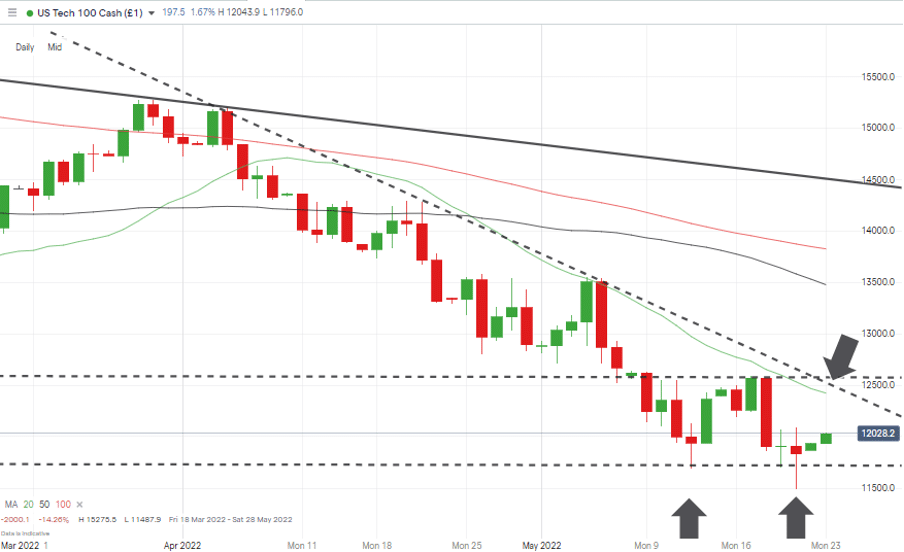
The main price driver continues to be the 20 SMA on the Daily Price Chart, which has, since 14th April 2022, beaten back any short-term rallies.
NASDAQ 100 Chart – 1Day Candles – 20 SMA & Trendline Working Together
Source: IG
Long positions
- Entry Level 1: 11,833 – Closing price of Friday 20th May. During that session, the tech stock index traded as low as 11,487, but a late market-wide rally into the close avoided a bear market being recorded in the S&P 500 index.
- Price Target 1: 12,588 – Significant selling pressure can be expected in the region of the price high of 17th May and the downward trend line, which dates from 5th April 2022. A break above this level would form a double-bottom pattern just as price breaks through a key resistance level.
- Price Target 2: 13,475 – Region of the 50 SMA on the Daily Price Chart
- Stop Loss: < 11,487 – Intraday price low of 20th May 2022 and year to date low.
FTSE 100
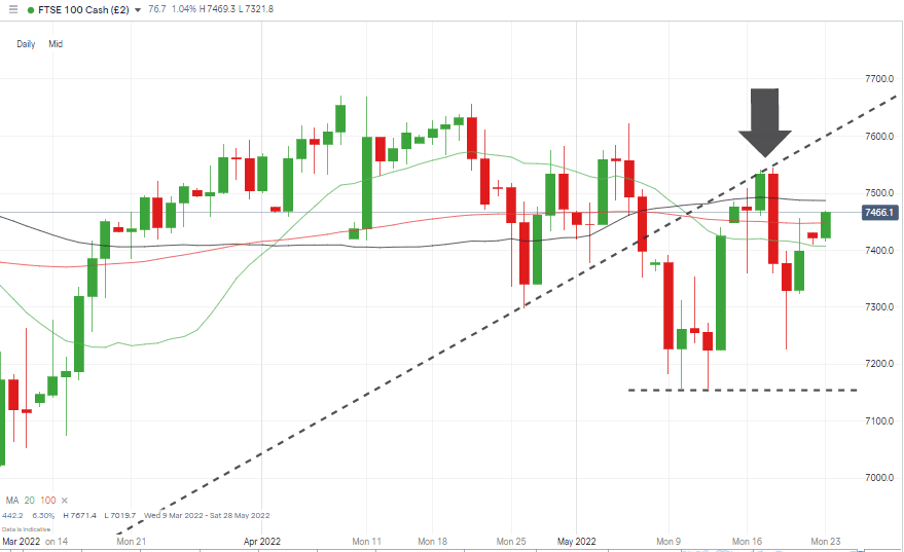
The FTSE 100 continues to outperform its US rivals. While the Nasdaq 100 and S&P 500 both posted down weeks, the FTSE posted a gain of 0.20%. Further strength in GBPUSD would work against those firms in the index whose earnings are generated in international markets, but the price of crude keeps on heading north which is good news for the oil and gas stocks listed in London.
Last week’s report picked out how the trendline, which dates back to 7th March 2022, could come into play, and price did reach the level of 7,541 on Tuesday 17th May but then fell back. A move above 7,486 would result in the index trading above all the key SMAs and suggest a second attempt at breaching that trendline resistance could be possible.
FTSE 100 Daily Price Chart – Trendline Is Back In Play
Source: IG
Long positions
- Entry Level 1: 7,447 – Region of the 100 SMA on the Daily Price Chart.
- Entry Level 2: 7,398 – Closing price of Friday 20th May 2022.
- Price Target 1: 7,486 – Region of the 50 SMA on the Daily Price Chart
- Price Target 1: 7,671 – Price high of Friday 8th April 2022.
- Stop Loss: < 7,156 – Price low printed on Tuesday 10th May 2022
Short positions
- Entry Level 1: 7,486 – Region of the 50 SMA on the Daily Price Chart
- Price Target 1: 7,226 – Intraday low of Thursday 19th May
- Stop Loss: > 7,607 – Region of trendline resistance.
Oil
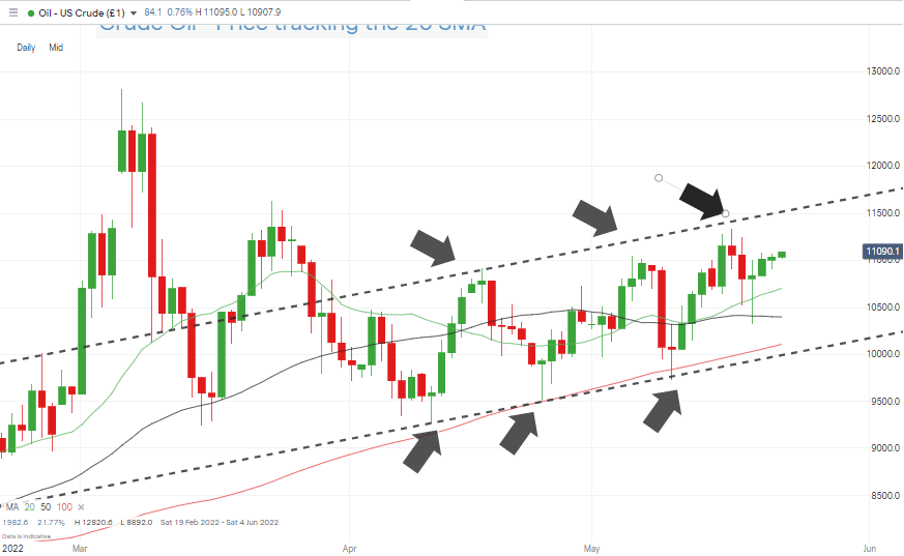
The upward trading channel in crude oil continues to hold. The bottom of the channel is supported by the 100 SMA on the Daily Price Chart, and the upper end is marked by moments when price diverges too far from the 20 SMA. Without any external catalysts influencing the markets, a short-term correction could be about to occur, although the long-term trend remains bullish.
US Crude Oil – Daily Price Chart – Range-bound Trading
Source: IG
Long positions
- Entry Level 1: 101.06 – Region of the 100 SMA on the Daily Price Chart.
- Price Target 1: 107.01 – Region of the 20 SMA on the Daily Price Chart.
- Stop Loss: < 100.00 – Region of the supporting trendline and psychologically important price level.
Short positions
- Entry Level 1: 114.73 – Upper end of the price channel.
- Price Target 1: 107.01 – Region of the 20 SMA on the Daily Price Chart.
- Stop Losses: > 115.00 – Round number resistance.
Forex
GBPUSD
The long-term prospects for GBPUSD remain bleak, but as identified in last week’s Trading Ideas Reports, there is potential for short-term reversals. The move from 1.2217 to 1.2560 in six trading sessions was impressive enough but is also matched by bullish candlestick patterns on the Daily Price Chart and a solid start to the new trading week.
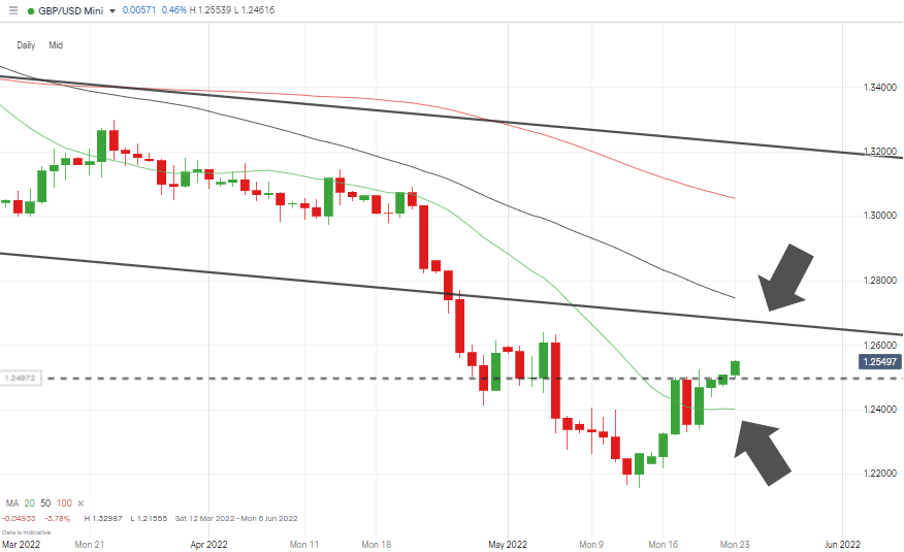
Now that price has broken through the resistance at 1.2500; there is potential for more short-term upward movement. Two factors point to the need for those who are long GBPUSD to consider locking in profits. The 20 SMA, which has been a reliable guide of the currency pair and price, is now diverging from that key metric. The second is the potential for significant resistance in the region of 1.2700, where the downward trendline dating to April 2021 and the 100 SMA can be found.
GBPUSD – Daily Price Chart – Relief Rally
Source: IG
Short positions
- Entry Level 1: 1.2700 – Calling the time at which the current rally ends could be hazardous as there are a lot of stop losses on long-term short positions, which could be triggered this week. Short positions around the 1.2700 price level would allow the bulls to run out of steam, and it marks the region of the 50 SMA on the Daily Price Chart and the multi-month trend line.
- Price Target 1: 1.256 – Region of the 20 SMA on the Daily Price Chart.
- Stop Losses: > 1.280 – Round number resistance, which sits above the 50 SMA on the Daily Price Chart.
GBPUSD – Daily Price Chart – 20 SMA & Trendline Resistance
Source: IG
Long positions
- Entry Level 1: 1.2500 – Psychologically important price level which acted as resistance last week but now offers support.
- Price Target 1: 1.2700 – Region of the downward trend line offered support until 25th April 2022 but now acts as resistance.
- Stop Losses: < 1.2400 – Region of the 20 SMA on the Daily Price Chart
Crypto – Bitcoin & Ethereum
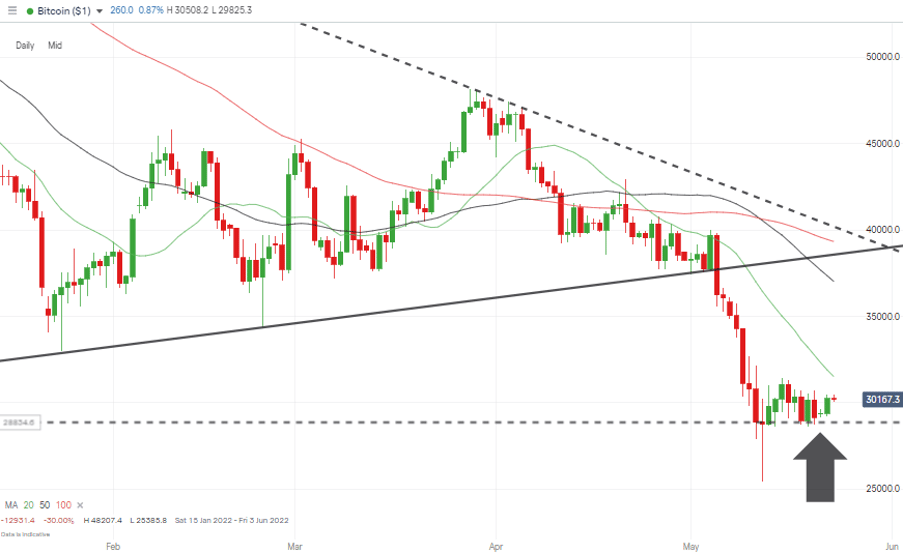
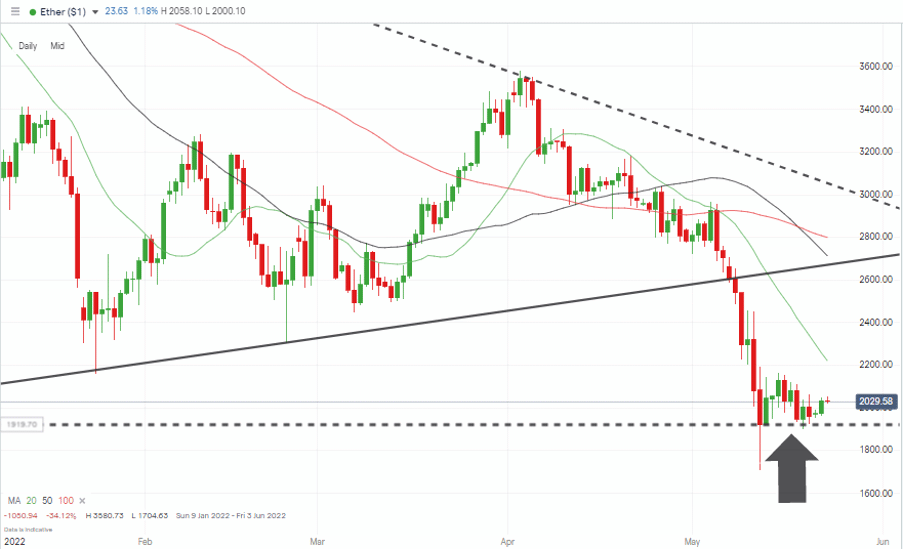
After a massive sell-off in the week of 9th May, both Bitcoin and Ether spent last week consolidating at their new lower levels. Further downside can’t be discounted, but Bitcoin’s week-on-week price rise of 1.37% and Ether’s of 0.40% will give hope to those looking to go long. There’s certainly room for a rally, and no need to feel that the opportunity to catch it has passed.
Both coins have tested psychologically important price levels, $30,000 in the case of Bitcoin and $2,000 in the case of Ether. They have also started the week trading just above those price bars, which sets up the classic strategy of buying dips whilst leaving stop losses just below those crucial support levels.
Bitcoin – Daily Price Chart – Consolidating
Source: IG
Bitcoin Long positions
- Entry Level 1: 28,714 – Price low of 22nd June 2021, which was tested but held during the last week.
- Price Target 1: 31,505 – Region of 20 SMA on Daily Price Chart.
- Price Target 2: 38,421 – Region of the 100 SMA on the Daily Price Chart and supporting trendline dating back to 24th January 2022.
- Stop Losses: < 25,385 – Below price low of Friday 13th May 2022.
Ethereum – Daily price chart – Key $2,000 Price Level
Source: IG
Ethereum Long positions
- Entry Level 1: 2,000 – Round number support which has come into play over the last two weeks.
- Price Target 1: 2,219 – Region of the 20 SMA on the Daily Price Chart
- Price Target 2: 2,666 – Region of the lower trend line of the wedge pattern and the 50 SMA on the Daily Price Chart.
- Stop Losses: < 1,920 – Year-to-date low of Thursday 12th May 2022.
Risk Statement: Trading financial products carries a high risk to your capital, especially trading leveraged products such as CFDs. They may not be suitable for everyone. Please make sure that you fully understand the risks. You should consider whether you can afford to take the risk of losing your money.
Forextraders' Broker of the Month
BlackBull Markets is a reliable and well-respected trading platform that provides its customers with high-quality access to a wide range of asset groups. The broker is headquartered in New Zealand which explains why it has flown under the radar for a few years but it is a great broker that is now building a global following. The BlackBull Markets site is intuitive and easy to use, making it an ideal choice for beginners.
