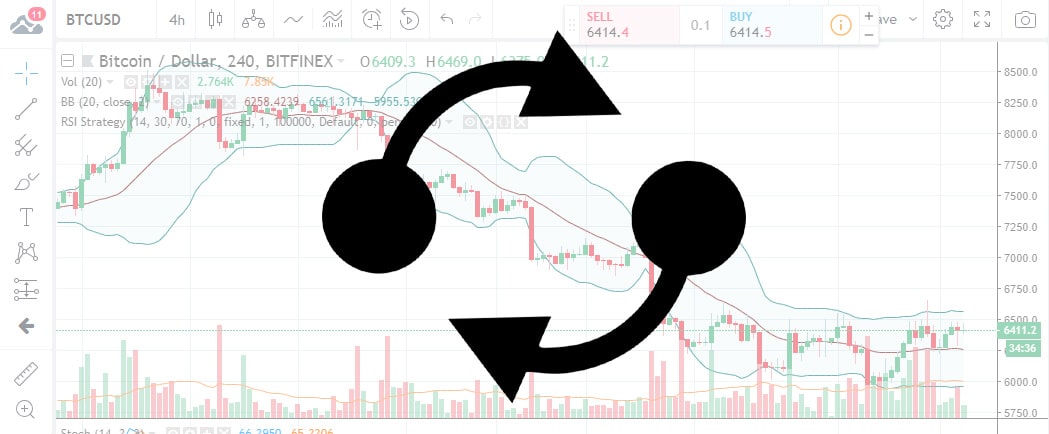
Yesterday and the day before, BTC and the cryptocurrency world in general saw a massive drop in value, one that took the latter straight to its 2018 low. While the largest cryptocurrrency by market share escaped writing a new low for the year, it only did so narrowly. The dip was followed by what experts coined “signs of life” on Wednesday. Are we looking at a short-term bullish correction, or will the bulls finally run away with the price for good?
While technical analysis is indeed quite unreliable in predicting the movements of the crypto markets, in this instance we really do not have anything else to fall back on, so let us take a closer look at those chart patterns and technical indicators.
Since its rebound from lows in the $5.8k area, BTC’s price has been hovering around the $6.4k mark. While this is good news to a certain extent, it isn’t much cause for optimism for the bulls: to actually execute a proper bullish correction, the price would have to toil its way past the $6,675 mark, defined by an inverse head and shoulders neckline resistance – according to technical charts. Frankly: at this point in this it does not seem to be able to pull off that move.
If a move past that critical resistance level did indeed materialize, it would open up the path to the $7.5k mark and possibly further.
According to the 4-hour chart, this break is possible (or rather: should happen) within the next 24 hours.
Taking a second peek at the 4-hour chart is indeed warranted, since the unfolding picture is very promising on it: the price has broken through the descending trend line of the drop from the recent $8.5k high, effectively heralding the end of the sell-off.
In addition to that, the RSI has adopted a bullish stance as well, above 50.00
On the daily chart, other optimism-inducing patterns have surfaced. On Tuesday, a long tailed candle pattern popped up, signaling bearish exhaustion and it was promptly followed by an inverted hammer pattern (a bullish one) yesterday. Apparently – according to the technical charts at least – the price has bottomed out and it is now on its way up.
Despite all that though, the majority of technical indicators still point to Sell. More precisely, 12 of the MAs do, while only one of them is neutral and two point to Buy.
2 of the oscillators say Sell and none point to Buy. The majority of them (9) are neutral.
If the foreshadowed rally fails though and the price finds acceptance under the $6.18k mark, the bears will be back in force, and they may indeed drag the price under the $6k psychological support level again.
As far as the fundamentals are concerned, there isn’t anything of major significance weighing down either side of the price-equation. There’s a slew of news concerning various acquisitions, the discovery of a vulnerability in Intel’s Software Guard Extensions, and South Korea’s awarding of a $880 million budget for tech innovation, including blockchain technology.
According to some, in regards to the fundamentals, it will take nothing short of a BTC ETF approval from the SEC to get the price moving upward. While there are indeed several ETF proposals on the SEC’s table, it is unlikely that an approval will be handed down this year in any shape or form. That may not mean much though.
Even as you’re reading this, several seemingly unimportant things are sliding into place in the background. Between the view that BTC may indeed become the world’s first global currency – expressed by the owner of the NYSE, to Jamaica quietly introducing crypto trading, are woven promises of massive future valuation for the blue chip of the crypto industry.
Forextraders' Broker of the Month
BlackBull Markets is a reliable and well-respected trading platform that provides its customers with high-quality access to a wide range of asset groups. The broker is headquartered in New Zealand which explains why it has flown under the radar for a few years but it is a great broker that is now building a global following. The BlackBull Markets site is intuitive and easy to use, making it an ideal choice for beginners.

