- Red-hot US inflation report signals more hawkish moves by the US Fed
- Key support / resistance levels trigger price retracements
- US Dollar Basket Index price channel holds firm
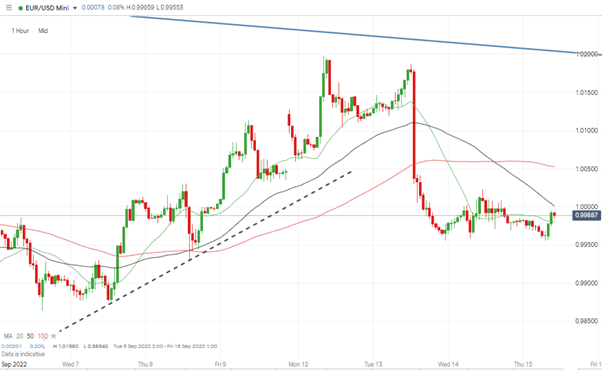
Major price moves followed the US Consumer Price Index (CPI) inflation report being released on Tuesday. Stocks on Wall Street posted their worst return for two years, with the Dow Jones Industrial Average ending the day down almost 4% and the Nasdaq plunging more than 5%. Forex traders also saw huge and immediate price swings, with EURUSD crashing by 1.40% in value in the hour after the CPI data announcement was made.
EURUSD Chart – Hourly Candles – Price Plunge After CPI Data Released
Source: IG
The consensus among traders is that the August CPI inflation report proved the rising value of the index is now about more than fuel. Sectors including healthcare, property rents and consumer items posted record returns. Veterinary costs were recorded as being up 10% on a year-on-year basis. This, combined, demonstrated the way that price rises are now being seen across the broader economy.
On an overall summary level, prices rose 8.3% in the 12 months through August, the US Labor Department said, faster than the 8.1% that analysts had expected.
Tuesday’s report significantly challenges the narrative that the current inflation trend is in any way ‘transitory’. With inflation morphing from being just a ‘food and fuel’ problem, the question is, what does this mean for major forex pairs?
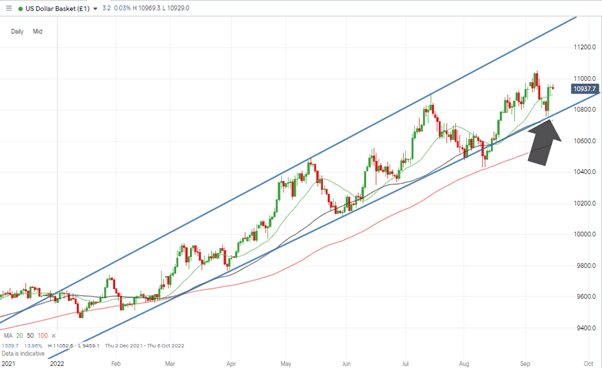
The US Dollar Basket Index, which measures the strength of the greenback against a group of other major currencies, has bounced off a key support level. The supporting trendline, which forms the lower end of a price channel dating from February 2022, was tested at the end of last week as risk-on appetite fed through the forex markets.
Also Read: EURUSD Forecast and Live Chart
US Dollar Basket Index – Daily Candles – Price Channel Holds
Source: IG
The Technical Analysis and Trading Ideas Report of 12th September identified that this week could potentially have been a time when a break of that supporting trendline could signify a paradigm shift in investor sentiment. Following the release of the CPI data, that potential reversal in trend now appears some way off.
With the dollar basket index now trading mid-range in the channel and above the 20, 50, and 100 SMAs on the Daily Price Chart, the bullish price pattern has remained intact. The year-to-date high of 11,052.6 posted on Wednesday 7th of September is back within range and could be due another test in the near future.
Should a higher swing-high be posted, then the medium-term outlook for USD will remain bullish, but, the weakness seen last week hints at the trend possibly running out of steam and a failure break 11.052.6 would likely trigger a sell-off and retest of the trendline.
People Also Read:
If you have been the victim of a scam, suspect fraudulent behaviour, or want to know more about this topic, please contact us at [email protected]


 Between 74-89% of CFD traders lose
  Your capital is at risk
  Your capital is at risk
  Your capital is at risk