
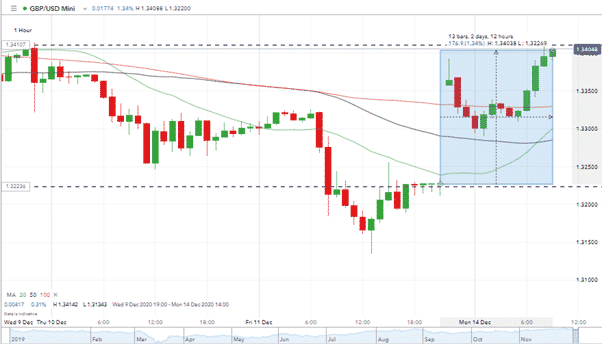
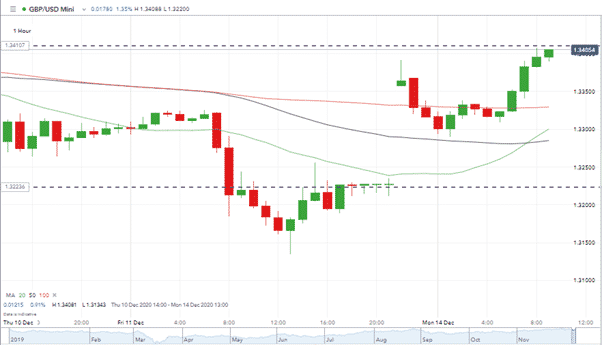
GBPUSD has had a good start to the week. After closing on Friday at 1.3232, it gapped up to print an opening price in Asian markets of 1.3363.
The price rally comes on the back of the decision by leaders from the EU and UK to push back the self-imposed deadline for reaching an agreement. Sunday evening had been pencilled in as the cut-off point but the talks are now continuing.
The pound’s break out appears to be more about there being no bad news rather than there being any sign of a trade deal. One noticeable detail missing from the statements made by the negotiating teams was any further deadline.
Source: IG
The Brexit talks are in limbo, both parties have advised that a deal is unlikely and GBP has rallied 1.24% in 10 hours of trading. That does raise the question of how much downside is there for those shorting at current levels.
Source: IG
Gap-fill
Monday is seeing the price of GBPUSD munch through a selection of resistance levels but the gap-fill from Friday’s close could at some point play on investor’s minds.
Absolute gains
Thursday and Friday of last week saw GBPUSD whipsaw with prices breaching the 1.32 support level and reaching as low as 1.3135 at one point. The extra noise hides the fact that in the seven days between Monday 7th – 14th December GBPUSD was up by 0.5%.
Posting a price increase in the face of the Brexit negotiations stumbling to a stand-still is quite something. There is a significant groundswell of buying pressure, apparently based on the assumption that a deal is always done in the end.
GBPUSD – How to trade the next move?
It could be that the clever money knows something we don’t. Protecting capital is sometimes the name of the game and paper-trading might be the safest option for those following the market in cable.
There are few resistance levels above the current price. The surge in GBP started back in September and price is some way above all its meaning moving averages.
Source: IG
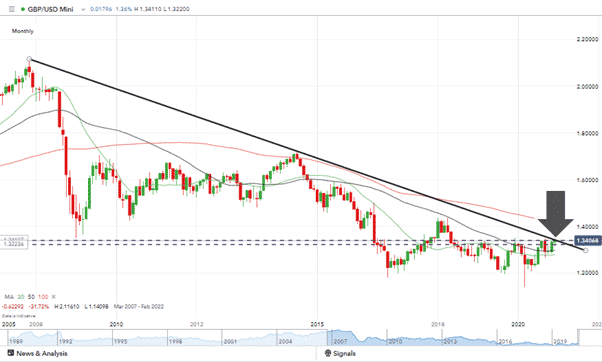
Those who are bearish on GBPUSD are forced to look at the upper trend line on the monthly chart. A significant long-term resistance, but in a market which currently appears to be more about short-term euphoria.
FTSE 100
Last Monday the Forex Traders analysts released a research note which picked out the convergence between GBPUSD and the FTSE 100 as being a possible pricing anomaly. Given the international nature of the firms who have shares listed on the FTSE, weakness in GBPUSD typically converts to higher equity prices.
Source: IG
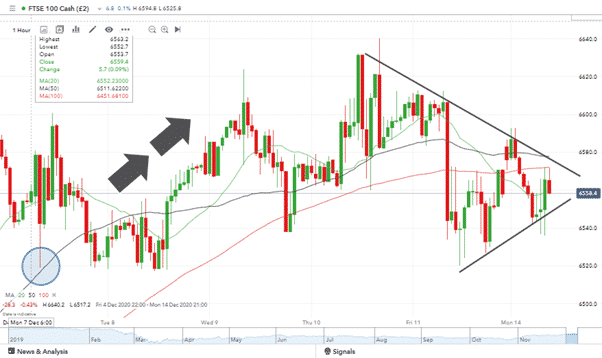
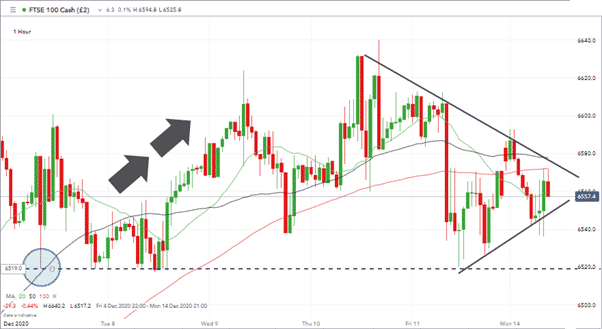
As it turned out price did rally through the week. There were pullbacks to the 6520 level which now appears to be a key support price for the FTSE 100.
Source: IG
The wedge pattern, however, highlights how the markets are losing some momentum in the run-up to the US Fed’s mid-week announcement on US interest rates. For the FTSE 100, and many other markets, it could be a case of steady-as-she-goes for the next 24-48 hours.
 Between 74-89% of CFD traders lose
  Your capital is at risk
  Your capital is at risk
  Your capital is at risk