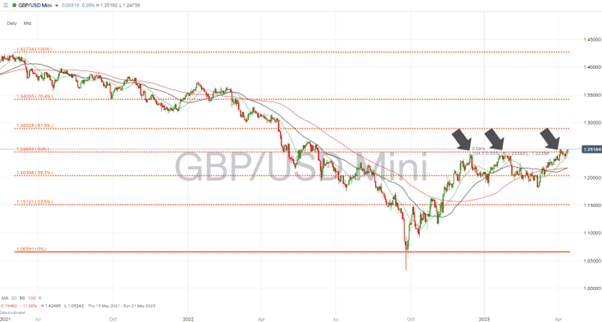
- GBPUSD approaches key triple-top resistance level
- Chances of price breaking through that level increased thanks to a shift in fundamentals
- Resistance levels above 1.24663 are few and far between
Fundamental and technical analysis factors are lining up to support an upward breakout in GBPUSD. With little resistance above the key 1.24663 price level, any upward trend could go on to build significant momentum.
Fed Pivot Points to Sterling Strength
The shift in the prospects in GBPUSD has been prompted by indications that the US Federal Reserve may be about to pivot on its interest rate policy. A lower-than-expected US CPI inflation number of 5% released on Wednesday suggests that the aggressive approach of the Fed could be beginning to draw in the rate of price rises.
At the same time, concerns about the banking system remain, with the collapse of SVB and Credit Suisse being a recent memory. Financial regulators are now faced with managing a banking system where customers can transfer funds out of accounts instantly using mobile apps, leaving any firm exposed to a ‘run on the bank’.
Cross-referencing to the crypto markets shows how the threat to the mainstream banking sector is, for some, at least very real. Bitcoin has this week broken through the psychologically important $30,000 price level and recorded price highs not seen since June 2022 as investors rush to the perceived security of non-fiat currencies.
The latest UK inflation report showed inflation is beating forecasts and recording double-digit year-on-year price rises. With UK banks so far being largely left out of the “who next” debate, that leaves room for the Bank of England to continue raising UK interest rates, triggering more significant demand for sterling from international investors.
GBPUSD Triple-Top Resistance
The fundamental analysis case for a spike in the price of cable comes as the currency pair is testing the key technical price level of 1.24663. That marks the 50% Fibonacci retracement level of the fall in the value of GBPUSD, which occurred between May 2021 and September 2022.
That level was previously tested in December 2022 and January 2023 but, on each occasion, held firm. With the additional prospect of US and UK interest rate policies possibly diverging, this could be the time that the price barrier is finally broken.
GBPUSD –Daily Price 2021-2023 – 50% Fib
Source: IG
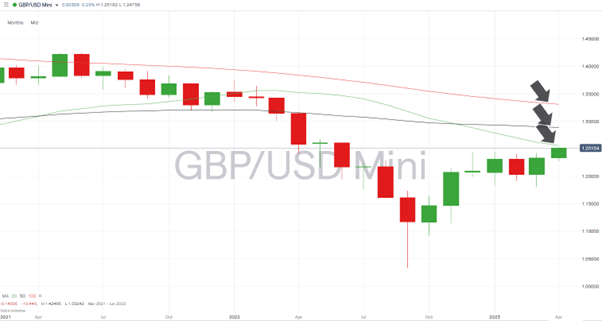
Resistance levels above the 1.24663 price level are formed mainly by long-term moving averages. The 20, 50 and 100 SMAs on the Monthly Price Chart sit at 1.25565, 1.28871, and 1.33094, respectively. If, and when, each one is broken, there is plenty of room for price to continue rising before meeting the next hurdle.
GBPUSD –Monthly Price 2021-2023 – SMA Resistance
Source: IG
People also Read:
- The Week Ahead – 10th April 2023
- EURUSD and GBPUSD go into Crucial NFP Announcement Hovering at Key Price Levels
- WEEKLY FOREX TRADING TIPS – 2023.04.10
If you have been the victim of a scam, suspect fraudulent behaviour, or want to know more about this topic, please contact us at [email protected]


 Between 74-89% of CFD traders lose
  Your capital is at risk
  Your capital is at risk
  Your capital is at risk