Monday the 22nd of February
The US Dollar has started the week forming interesting technical patterns, including a double or triple-bottom and an upward trend-line break. The price rise in USD is based on strong US fundamentals, as reflected in data released last week. Whatever the reason, it looks likely to have serious implications for all other asset groups.
USD DXY Index
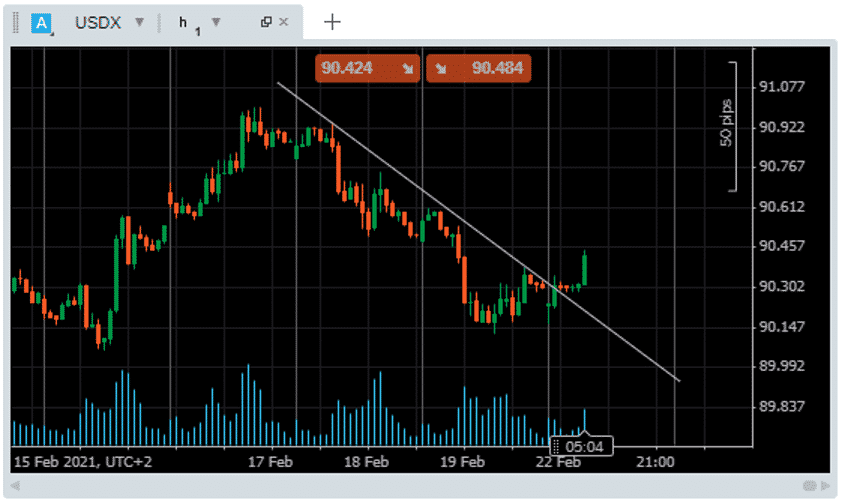
The USD index – the dollar against a weighted basket of other G7 currencies – has on an hourly basis broken a downward trend line formed since Thursday.
USD – 1H price chart – Trend line break
Source: Pepperstone
1H chart – trend line break.
- Low volatility sideways trading during the Asian session
- Followed by strong green candle in the hour before European exchanges open
- Trading volumes are NOT confirming the move
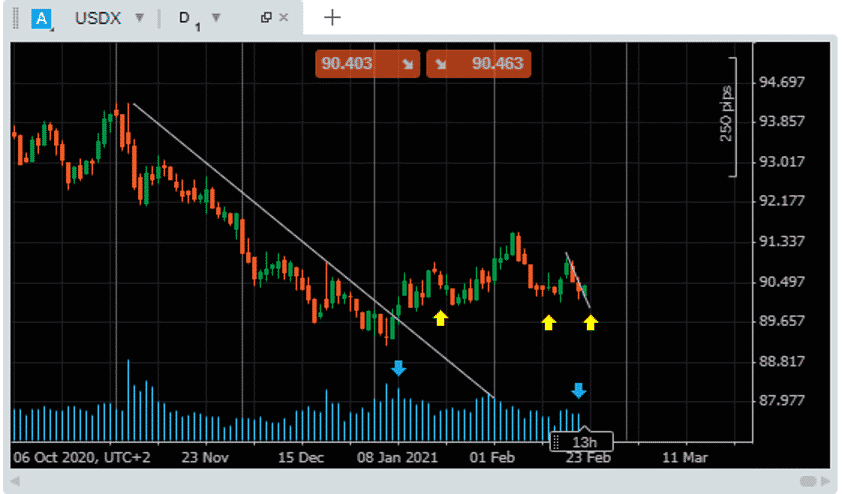
USD – 1D price chart – Triple Bottom
Source: Pepperstone
1D price chart – Triple Bottom
- Repeated support for USD at 90.15
- Bears failing to break the “big number” and drive price below 90.00
- Q3 downward trend line break has neither taken-off nor capitulated
- Trading volumes declining since January the 8th peak
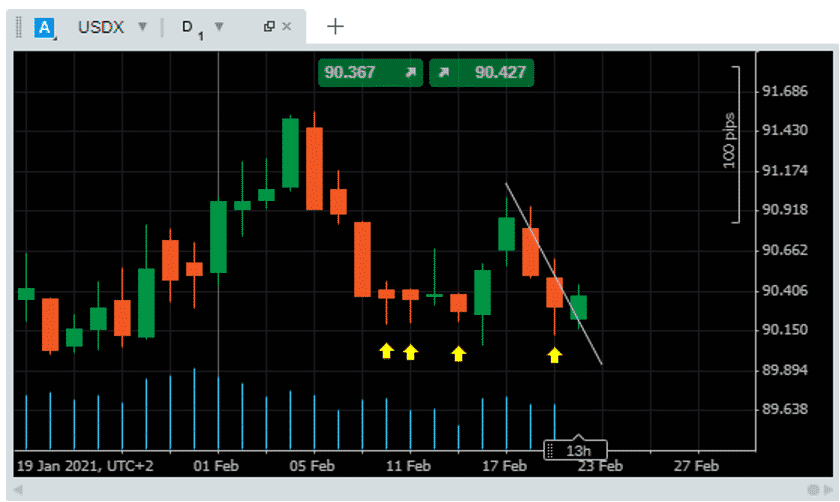
USD – 1D price chart – Triple Bottom – Third time lucky?
Source: Pepperstone
1D price chart – Triple Bottom – Third time lucky?
- Bottom #2 of the 11th of February associated with strong support and hammer candlesticks
- The three hammers were though all red with the breakout green candle of Tuesday the 16th encompassing them all
- The low of Tuesday the 16th marked the month-to-date low for USD. Signalling strong support at 90.051
- The index has failed to print a price below 90.00
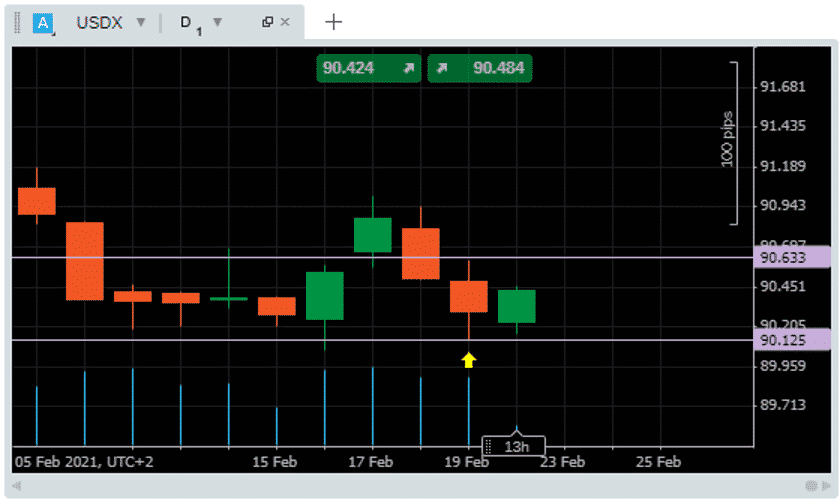
1D price chart – The candle to watch
Source: Pepperstone
On Monday, much rests on whether USD can find the momentum to break out of the range of Friday’s candle. A day of ‘trading inside’ still can’t be ruled out and would indicate further sideways trading.
- Monday morning strength in USD has not been backed by increased trading volumes
- Price is strong on an hourly basis but on a daily one it is still in the mid-price range of Friday’s trading
- A break above Friday’s maximum price of 90.633 would be bullish
- An alternative scenario – break to downside below Friday’s low of 90.125
The lack of volume is a big concern for dollar bulls. Last week’s positive data releases were followed by a justifiable bounce in USD. If this isn’t a catalyst for further upward movement, sellers may return to the market.
- Stronger-than-anticipated US retail sales data
- Thursday’s unemployment data showed that claims by first-time applications increased by 861,000 in the week ending February the 13th.
The US Fed’s appetite for printing dollar bills continues to increase the supply of the currency, and unless demand picks up, price could continue to slide and test the January lows of 89.34
How the USD Uncertainty Could Impact the Markets this Week
Once again, the USD DXY index is the market to watch. Not for the first time, the index is acting as a barometer for so many other markets and risk-appetite in general.
The current moves might be relatively undramatic compared to the significant swings of 2020. However, if they represent price consolidating before reversing a month-long trend, it will shake the markets.
The wavering by USD is likely to result in choppy equity and forex markets as bulls and bears weigh up long-term economic prospects.
If you want to know more about this topic, please contact us at [email protected]


 Between 74-89% of CFD traders lose
  Your capital is at risk
  Your capital is at risk
  Your capital is at risk