FOCUS ON: US & UK Inflation Reports Dominate the Week’s News Flow
- US and UK Consumer Price Index (CPI) inflation data released on Tuesday and Wednesday
- With inflation still guiding interest rate policy both reports have the potential to trigger market moves
- US earnings season drawing to a close
Market attention turns back to inflation data this week. Rising prices triggered the cycle of interest rate hikes which characterised 2022. The upcoming report will give traders an idea of whether 2023 will be a case of ‘more of the same’.
- Tuesday 14th February – 1.30 pm (GMT) US CPI Inflation Report for January 2023
- Wednesday 15th February – 7.00 am (GMT) UK CPI Inflation Report for January 2023
- Thursday 16th February – 1.30 pm (GMT) US PPI Inflation Report for January 2023
Forex
GBPUSD
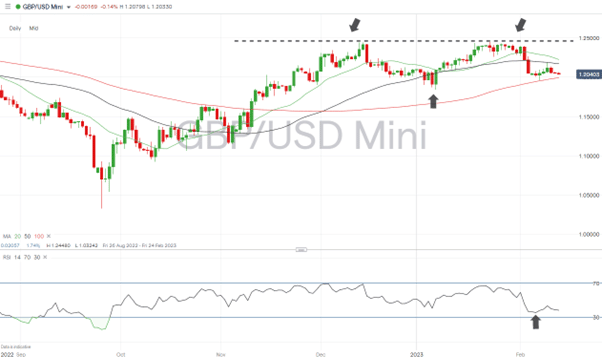
The UK economy narrowly avoided confirming it was in a technical recession last week. The GDP data for Q4 2022 showed the economy flatlined rather than contracted, but the forecast for growth in 2023 remains pessimistic.
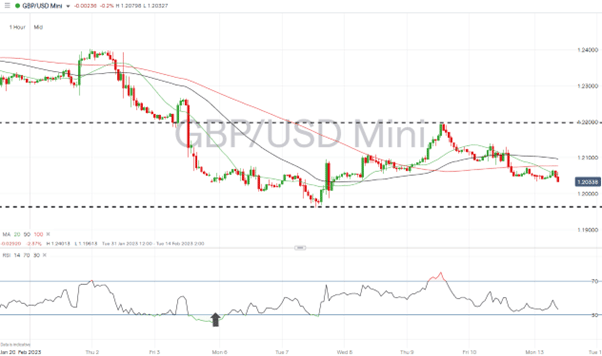
The CPI inflation report due on Wednesday can be expected to trigger moves in GBP currency pairs. With the Bank of England keeping ‘all options open,’ a surprise in either direction can be expected to lead to significant price moves.
Also, look out for UK monthly employment numbers to be released at 7 am on Tuesday 14th February and UK Retail Sales numbers due out at 7 am (GMT) on Friday 17th February.
GBPUSD Chart – Daily Price Chart
Source: IG
GBPUSD Chart – Hourly Price Chart
Source: IG
EURUSD
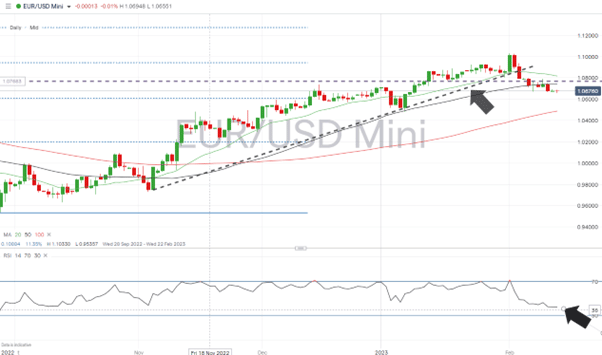
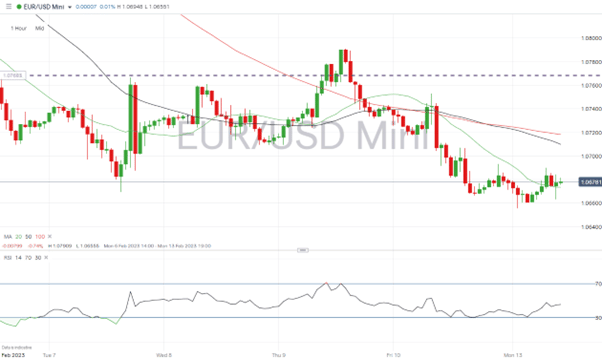
Last week was a relatively quiet news week for euro traders, but that didn’t stop EURUSD from making some of the most dramatic moves in the forex market. The coming week again lacks any blockbuster announcements, which opens the door to key resistance/support levels and technical indicators coming into play.
EURUSD Chart – Daily Price Chart – Trendline and SMA Break
Source: IG
EURUSD Chart – Hourly Price Chart
Source: IG
Indices
S&P 500
US earnings season is drawing to a close. FAANG stocks and big banks have given their updates to investors, and this week’s highlights in terms of corporate news come from Coca-Cola (Tuesday), Cisco (Wednesday), and Dropbox (Thursday).
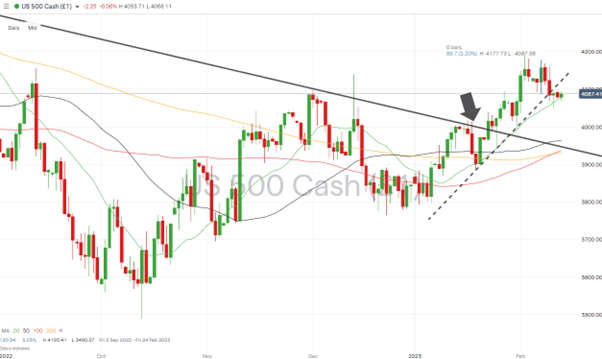
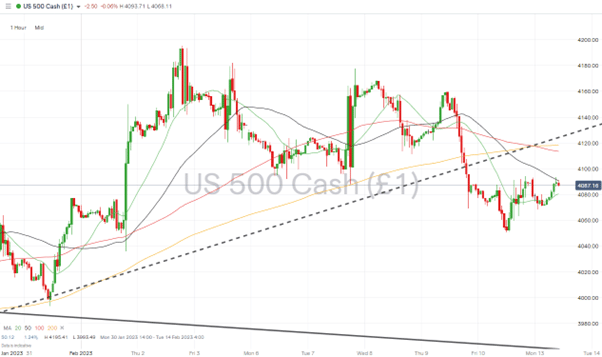
The US CPI inflation data due on Tuesday 14th February is the major economic report of the week. It can be expected to have far-reaching consequences for global equity markets.
S&P 500 Chart – Daily Price Chart –Trendline Break Followed by Sideways Trading
Source: IG
S&P 500 – Hourly Price Chart
Source: IG
People Also Read:
- Dollar Tests Key Inflection Point – Stick or Twist for the Greenback
- The Dollar Takes a Breather
- The Week Ahead – 6th February 2023
Risk Statement: Trading financial products carries a high risk to your capital, especially trading leverage products such as CFDs. They may not be suitable for everyone. Please make sure that you fully understand the risks. You should consider whether you can afford to take the risk of losing your money.

 Between 74-89% of CFD traders lose
  Your capital is at risk
  Your capital is at risk
  Your capital is at risk