A classic stand-off is taking shape. Bulls that have had a good two-week run appear willing to put on more risk. Bears though are suggesting that the eye-watering price moves might be a case of too much, too soon.
GBBPUSD
Looking at Cable on different time frames demonstrates the current debate on risk.
The four-hour candle chart has bullish price action and an RSI of 46. So, on that timescale, it looks far from being overbought.

Source: IG
Switch to the Daily candle chart as price is coming up to a long-held resistance level. The 1.35 price region having been tested but not broken in December 2019 and September 2020.

Then again, the daily RSI for GBPUSD is currently 57. Again, hardly a sign that buyers are just about to run out of momentum.

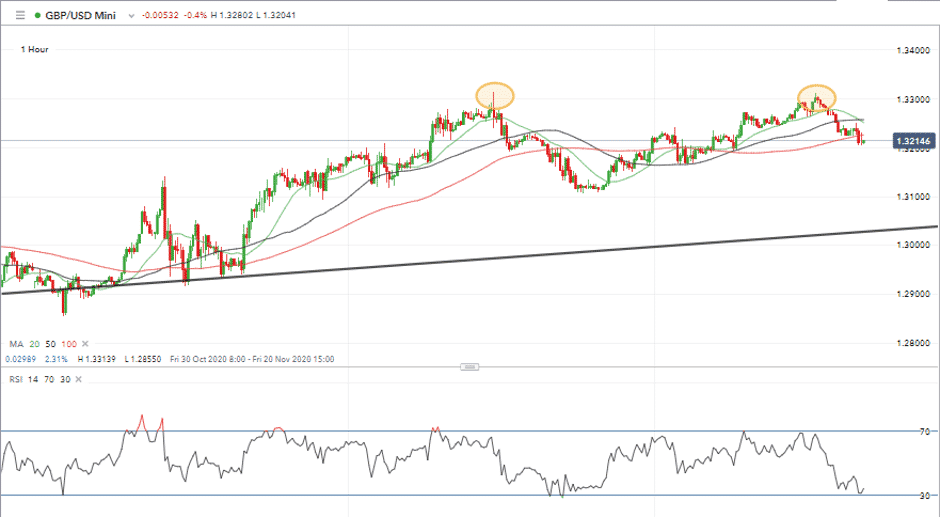
The hourly-candle chart has an RSI around 30, a level at which some would be looking to step in and buy. The potential double top price pattern does though mark a resistance level at $1.33.
With price currently trading in the region of $1.321 and the long-term support line at $1.303, there is potential for GBPUSD to move a dollar in value in either direction before hitting firm resistance.
The determining factor will most likely be Brexit related. GPUSD has become the de facto measure of the probability of a smooth Brexit happening or not.
Positive news from meetings in London or Brussels could give the currency enough of a boost to break through the $1.35 resistance. Negative information would most likely see GBPUSD trading some way below $1.30.
The cautionary note is that those two psychologically important, ‘big number’ levels could be tested at any time.
For those with positions in GBPUSD or that are thinking of putting one on, there could be significant moves before the week is out. One date for the diary is the EU’s chief negotiator Michel Barnier being expected to brief the 27 EU member states early on Friday.
The three main sticking points remain. Competition regulation protocols, fish and a road map on how to govern the deal all still need to be resolved.
It’s hard to bet against a deal finally being agreed but it is unlikely that one will be confirmed tomorrow. Barnier’s update is likely to outline the process offering a mixture of “opportunities and challenges”.
Equities
The stock markets appear to be following rather than leading the decision-making process. This situation is exacerbated by the rotation going on within the equities sector.
COVID-proof tech stocks which rallied in the earlier part of the year are no longer leading the charge. The big names are all now some weeks down the line from when they last posted a year-to-date high.
- Facebook – August
- Amazon – early September
- Netflix – early September
- Peloton – mid-October

You can take your pick on whether we’re watching price consolidation or a market topping out. If you’re watching and waiting, then the Nasdaq’s 11961 and 12000 price levels now represent resistance to upward movement and could be a key indicator.
 Between 74-89% of CFD traders lose
  Your capital is at risk
  Your capital is at risk
  Your capital is at risk