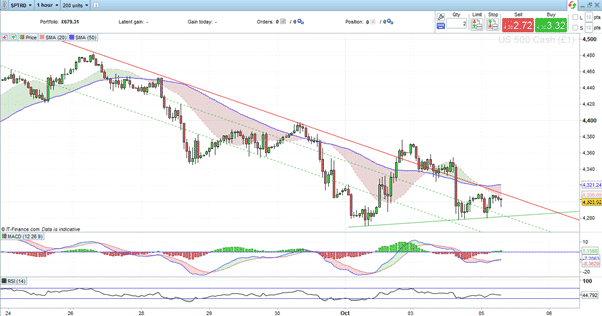
It’s been a choppy week in the markets, and it’s still only Tuesday. The best demonstration of risk appetite draining away was the Nasdaq 100 losing more than 2% in value on Monday. It is, though, the falling wedge pattern in the US 500 index that shines the best light on how the rest of the week might pan out.
US 500 Index – 1Hr price chart – Wedge Pattern
Source: IG
The US 500 is made up of stocks from a more diverse range of sectors than the Nasdaq. The bellwether of the global stock markets was also down on Monday, but the price action pattern suggests a degree of inertia may be setting in. The willingness of price to be funnelled into the end of the wedge pattern rather than break out early to the upside or downside suggests current price levels could hold for the short term. That shouldn’t be too surprising with all eyes now turning to the US Non-Farm Payroll Job numbers due on Friday.
AUDNZD Case Study as Tapering Policies Come into Play
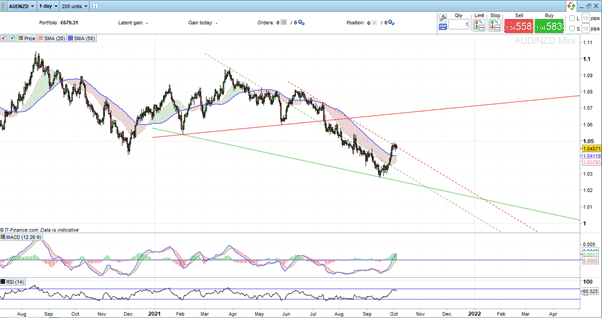
Trading strategies with more extended time frames are finding opportunities in the forex markets. Trading the much talked about ‘tapering’ could be a chance to catch a multi-week trend, and the AUDNZD forex pair is a good example.
AUDNZD – Daily Price Chart
Source: IG
In this currency cross, it’s a case of trading the market as if tapering is already priced in – buy the rumour, sell the fact.
The central banks of Australia and New Zealand have given clear guidance to the markets on their approach to monetary policy. A dramatic divergence is forming with RBNZ, indicating it will raise rates as early as next week; however, RBA declaring rate hikes in Australia won’t come into play until 2024.
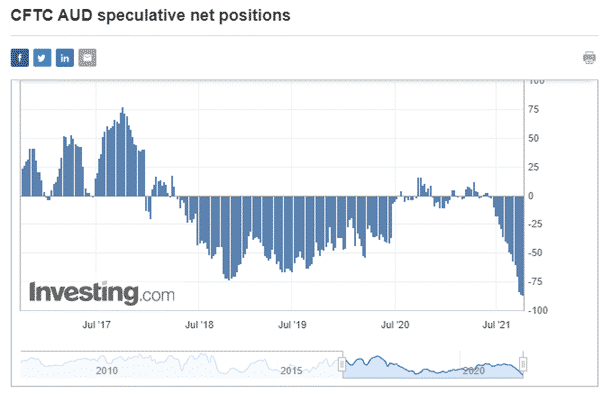
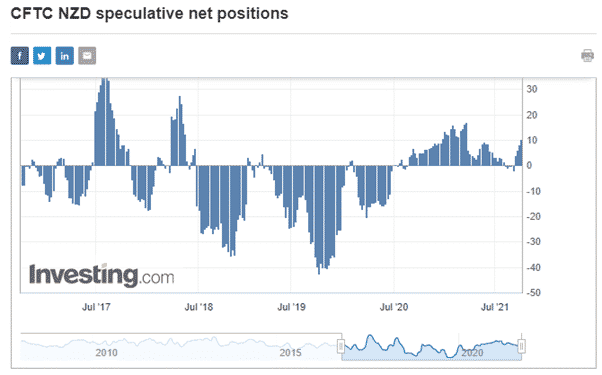
The slightly counterintuitive trading idea is based on the divergence already being priced in. As is the way, Central Bank guidance has been drip-fed into the markets over an extended period, and CFTC data now reveals two alarming stats for anyone who thinks AUD will weaken from here:
- Shorts in AUD are already at their highest level since November 2018
- Speculative Net Long Positions in NZD have also already been established
Source: Investing.com
Source: Investing.com
With everyone already long Kiwi and short Aussie, the risk is that those positions could unwind. The price chart for AUDNZD shows Aussie beginning to show some strength. All of the news appears to be already priced in, which means any reaction would be a somewhat counterintuitive rise in the value of AUDNZD.
Another price move catalyst to monitor – China Coal
AUD has also taken a battering due to the souring relations between Canberra and Beijing. China has cut back on coal orders from Australia, but that is another situation where something will have to give – China’s power plants are currently reporting the lowest coal inventory levels for ten years.
Short Aussie, long Kiwi looks like a crowded trade and one that could reverse just as the interest rate moves start to come into effect thanks to the RBNZ’s upcoming announcement. The target price is currently in the region of the support-resistance line at 1.07.
If you have been the victim of a scam, suspect fraudulent behaviour, or want to know more about this topic, please contact us at [email protected]

 Between 74-89% of CFD traders lose
  Your capital is at risk
  Your capital is at risk
  Your capital is at risk