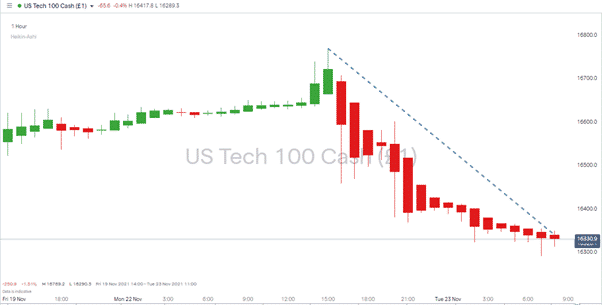
President Biden’s reappointment of Jerome Powell as Chair of the US Fed caused market sentiment to flip-flop dramatically on Monday. The Dow Jones Industrial Average index closed just 17 points higher on the day when it had earlier in the session posted intra-day prices more than 300 points above Friday’s close. The Nasdaq 100 index continued its price slide overnight and was more than 2% off its Monday’s highs when European exchanges opened on Tuesday.
Nasdaq 100 – Hourly Price Chart – 19th– 23rd Nov 2021 – Sell-Off
Source: IG
Tech Stocks Sell-Off
Suggestions that ‘progressive’ Fed officer Lael Brainard might get the top job didn’t materialise, and that meant hopes of a bounce in risk-on assets also faded. Powell’s plans for two interest rate hikes next year, starting in June, represent a tighter monetary policy than Brainard’s. The question now is how the subsequent few trading sessions might play out, considering it’s a short week due to Thanksgiving and most of the economic data due to be released is Eurozone, not US-related. Technical and fundamental factors are coming into play as the market looks to recalibrate before Wall Street takes the day off on Thursday.
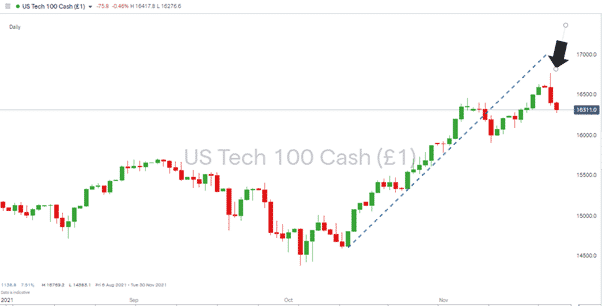
Nasdaq 100 – Daily Price Chart – 2021 – Tombstone
Source: IG
Monday’s long tombstone candle on the Nasdaq Daily price chart highlights the change in momentum. If you take this into consideration with the trend line break, there is a risk of further downward movement. A break of the swing-low at 15,904 on the 10th of November would signal the end of the recent bull run and raise the chances of a more serious correction coming into effect.
Dollar Strength
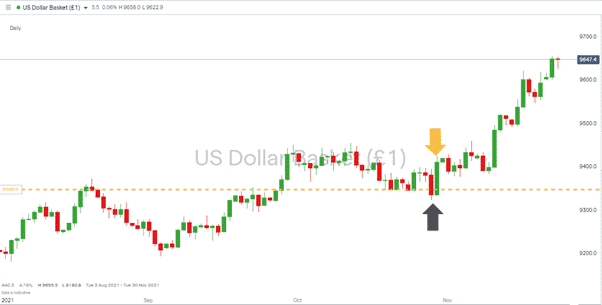
The prospect of higher interest rates unsurprisingly spurred the US dollar on. Powell’s appointment was a key question mark as to whether the breakout from the 29th of October would continue.
USD Basket – Daily Price Chart – 2021 – Breakout
Source: IG
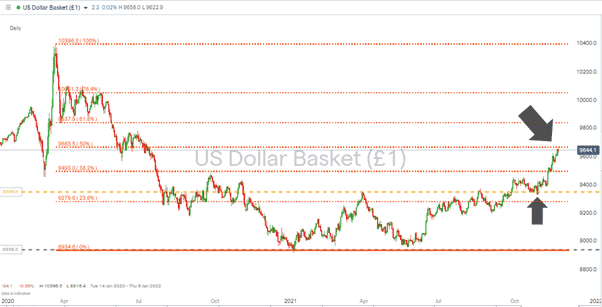
The USD Basket index is now trading at the highest levels since July 2020. The 50% Fib retracement from 2020 highs sits at 9665, so it is not within touching distance of current prices, with Monday’s highs being 9655.
USD Basket – Daily Price Chart – 2020 – 2021 – Fib Retracement
Source: IG
The Fib retracement can be expected to offer substantial resistance, particularly with the steep gradient of the recent rally introducing the idea that USD is overbought in the short term. A break of 9665 and further USD strength would ring alarm bells that a paradigm shift is taking place in the markets. There may have been no change at the top of the Fed, but the market has certainly taken on a different mood.
Thanksgiving Holiday
Time will tell whether the shortened trading week offers support to asset prices. Some of the selling pressure could result from investors locking in profits before the extended break, and that trimming of risk can often become a self-fulfilling prophecy. On the other hand, it’s hard to see where any buying pressure might come from. Tech-stock dips are a popular target for many traders, but this week could see those running speculative strategies take the opportunity to sit on their hands, let the Fed news play out, and enjoy the holidays.
If you have been the victim of a scam, suspect fraudulent behaviour, or want to know more about this topic, please contact us at [email protected]
 Between 74-89% of CFD traders lose
  Your capital is at risk
  Your capital is at risk
  Your capital is at risk