
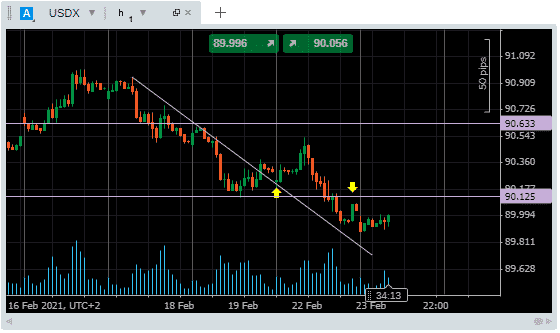
Monday’s failed break out by USD has triggered a frenzy of buying activity in risk-on assets. The start of the week saw a tentative move through a two-day downward trend-line. It wasn’t supported by an increase in trading volumes and yet another “new dawn” for USDX ultimately fizzled out at 90.543.
The resulting slide in USDX continued into Tuesday’s trading sessions. USDX was breaking support levels at 90.125 and 90.00 and triggering buy signals for traders in other asset groups.
USD – 1H price chart – Failed Breakout
Source: Pepperstone
The USD DXY index was flagged up by Forex Traders’ analysts as the indicator to watch. As forecast, Monday’s weakness in USD did result in a rally in other markets, the question being when and how to jump aboard.
Copper
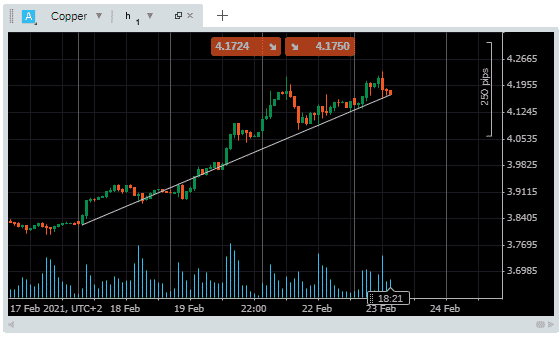
Those backing the idea that we’re about to see a commodities super-cycle will note that copper is now trading +7% higher than it was on Thursday. The momentary strength in USD on Monday morning failed to test the supporting trend line and the rally from the 18th of February has offered few dips to buy into. Friday morning’s sideways trading being the last time anything like weakness was seen in the market.
Copper – 1H price chart
Source: Pepperstone
Oil
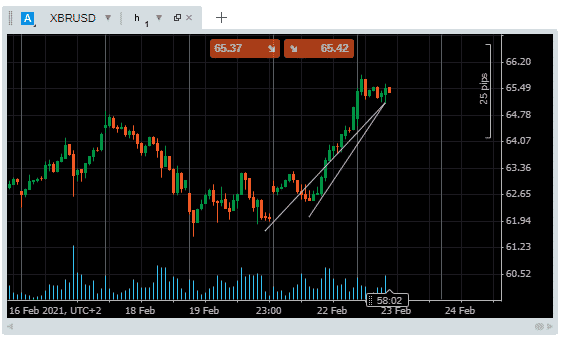
It’s a similar story for Brent Crude. The gradient of the trend line on the hourly price chart is eye-watering. The RSI is still bullish but the pace of the climb suggests a short-term pull-back could come into play even though buyers currently dominate the market.
Oil – 1H price chart
Source: Pepperstone
Now trading above the daily pivot of 65.30, the path of least resistance continues to be upward.
Target prices of 67.00 and 68.30 being some way off current price levels and likely to tempt many into the market.
Those looking for pull-backs or riskier short positions will have 64.75 and 63.90 at target price levels.
Silver
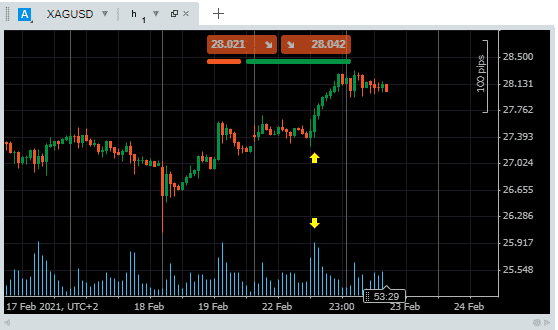
Fans of silver will note that an uptick in trading volumes also supported the metal’s price rally on Monday. A burst of activity saw the price rise by more than a dollar between 13.00 and 20.00 London time.
Oil – 1H price chart
Source: Pepperstone
Price targets to the upside are still some way off with the monthly high of $30.10 and the ‘big number’ resistance of $30.00, both of which are still $2 off current price levels.
UK’s Roadmap out of Lockdown
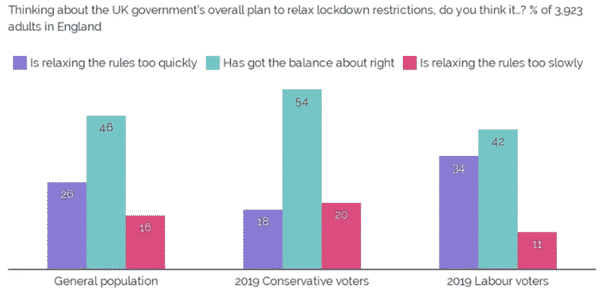
The UK’s roadmap out of lockdown was set out on Monday and managed to gain broad approval. In a snap poll, most of those asked stated that the plan “got the balance about right”.
Source: order-order
The last lockdown restrictions aren’t due to be lifted for 118 days; however, the speed of the roll-out of vaccinations has seen the UK take on the role of guinea-pig for other major world economies.
The demonstration that there is a broadly acceptable template for a return to normality also buoyed the markets and built a case for those following fundamental strategies. Arguments that there will be a recovery in corporate earnings in the second half of 2021 are beginning to look well-founded.
If you want to know more about this topic, please contact us at [email protected]
 Between 74-89% of CFD traders lose
  Your capital is at risk
  Your capital is at risk
  Your capital is at risk