Monday’s spike in price volatility surprised some and announced to all that traders in the financial markets should, at least for the foreseeable future, expect the unexpected. In terms of price volatility, the first trading session of 2021 looked very much like those of 2020 – but one key element was missing.
January Case Study – FTSE 100
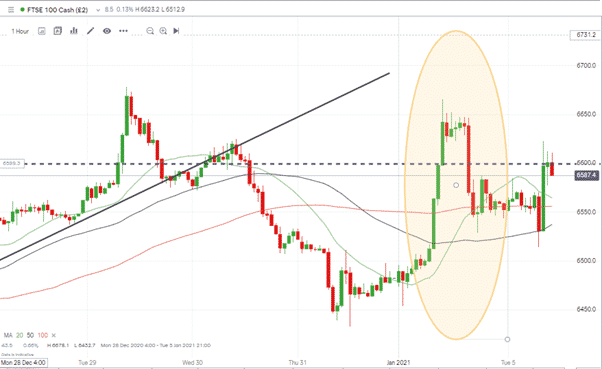
The UK’s flagship equity index started 2021 with a price surge that at one point printed an intra-day gain of 2.5%.
A 10% return for the whole of 2021 would be realistic and welcomed by most passive investors. The fact that the index had met one-quarter of that annual target before traders had even had their second cup of coffee of the morning suggests 2021 is going to be a white-knuckle ride.
Anyone suffering from FOMO who jumped on board the rally at 6640 was soon disappointed. The index slid 1.7% when the governing bodies in Edinburgh and London both indicated the possibility of a third lockdown.
It might be a new year but price volatility is still with us as is the virus.
Source: IG
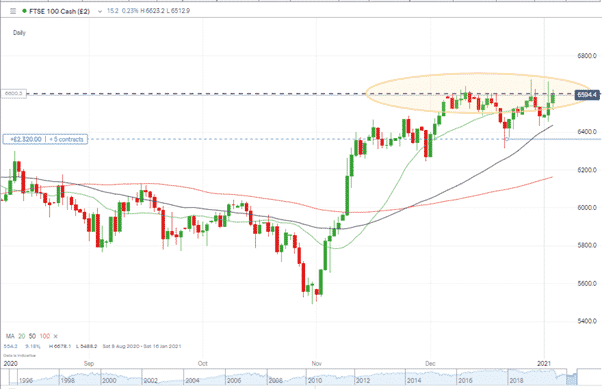
Key support appears to be at the psychologically important 6600 level. Is price action forming a consolidation pattern or are the long tails on the upper side of the daily candles pointing to repeated failed break-outs?
A close above 6600 would offer hope to the bulls. With so much uncertainty, there is a risk that going long might be based on boredom or FOMO, but any traders looking to put on long positions could use tight stop-losses.
The next critical support level is at 6579, which marks the 61.8% Fib retracement from the March 2020 crash.
Some analysts have backed the FTSE’s long-term prospects based on value stocks typically doing well out of any broad economic recovery. When compared to other global equity indices, the UK index is definitely lagging behind its peers.
More active investors will be looking to trade the noise as the FTSE struggles to recover to its pre-Covid levels. A reason to doubt that yesterday’s price surge signalled the start of a long-term bull run for UK equities.
Source: IG
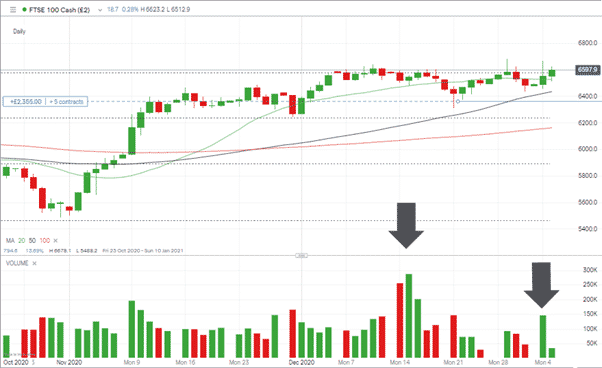
A key metric to keep an eye on is trading volume. Moves on Monday were dramatic and the gut feeling might have been that the markets were back up and running; however, the charts tell a different story.
Trading volumes on Monday, the first trading day of the year, were about half the size of what they were on the 14th and the 15th of December. Instead, they were more in-line with the volumes seen on the 21st of December.
Source: IG
Any ‘real’ move in the markets would need to be backed up by a more significant amount of trading activity than was seen on Monday.
The lack of a ‘real’ move might be just what range traders are hoping for. The intra-day swings offer up a lot of opportunities for those who trade what they see, not what they want to see. Given the absence of volumes to support any move, it could be an excellent time to take a few moments setting up a Demo account and tracking events using virtual funds.


 Between 74-89% of CFD traders lose
  Your capital is at risk
  Your capital is at risk
  Your capital is at risk