- US inflation numbers are set to outline prospects of interest rate cuts by the Fed.
- Price data reports are to follow a better-than-expected jobs report last Friday.
- The UK GDP data for November could result in GBPUSD continuing to outperform other major currency pairs.
Bullish sentiment in the forex markets came undone on Friday after US jobs growth numbers for December came in better than expected. Analysts predicted the labour market would add 170,000 new hires in December, and the actual figure was 216,000. That resulted in intraday spikes in forex price volatility as investors reassessed the likelihood of the US Federal Reserve being able to reduce interest rates through Q1. This week’s key US inflation reports will offer further insight into base-level economic activity and more clues regarding likely moves in currency rates in the coming weeks.
US Dollar
Thursday’s US CPI inflation report is forecast to show price pressure reaching a significant high-water mark. Core CPI is expected to be 0.2% on a month-to-month basis, down from 0.3% the previous month, and year-on-year inflation is predicted to remain unchanged at 4%. Any suggestions that prices will continue to rise more than expected would tie in with the hot jobs number posted on Friday, leaving the Fed with few alternatives to adopting a more hawkish approach. That would require traders to recalibrate their strategy, with many currently forecasting US interest rates falling in the first three months of 2024.
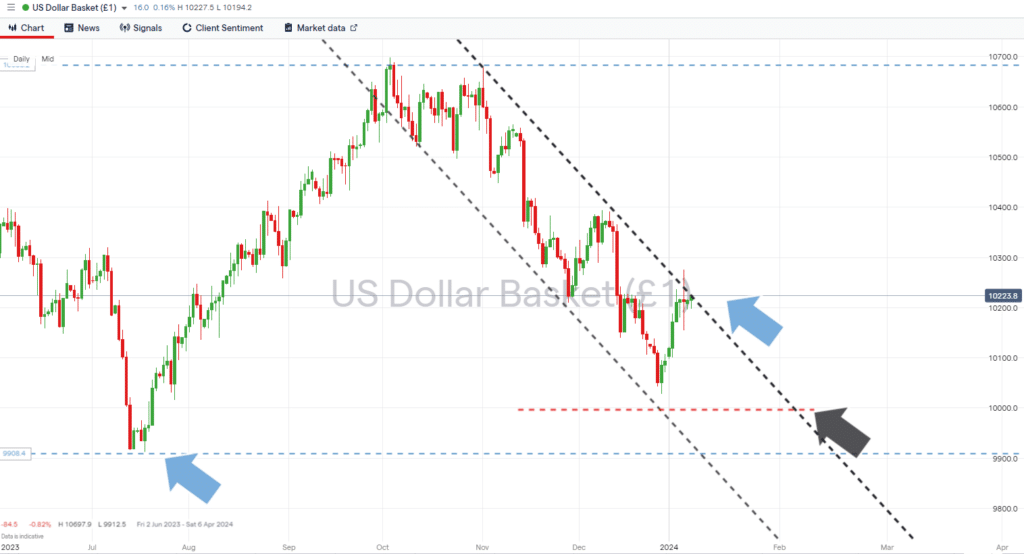
The US Dollar Basket index price chart highlights how the currency is now testing the resistance trendline of the downward channel, which began forming in October 2023. A break of that line would suggest dollar-bears won’t have everything their own way in the coming weeks, and the psychologically important parity price level of 1.000 can also be expected to provide resistance to further downward moves in the DXY.
US Dollar Basket Index – Daily Price Chart – Test of downward price channel?
Source: IG
The key number to watch: Thursday 11th January at 1.30 pm (GMT). US Consumer Price Index (CPI) inflation report: Analysts forecast inflation in December to have been 0.2% month-on-month and 4% year-on-year. Compared to 0.1% and 3.1%, respectively, in November.
Key price levels: 100.00 – Support in the form of the parity price level. The US Dollar Basket Index reached as low as 100.27 on 28th December, and without a breakout of the downward channel, it can be expected there will be a test of the important ‘round number’ support level at some point.
EURUSD
Germany’s trade balance report on Monday will shed more light on the health and prospects of the Eurozone economy. It comes at a time when economists are increasingly concerned about how high fuel prices and societal shifts are putting pressure on the automotive sector, which has long been the powerhouse of the Eurozone region.
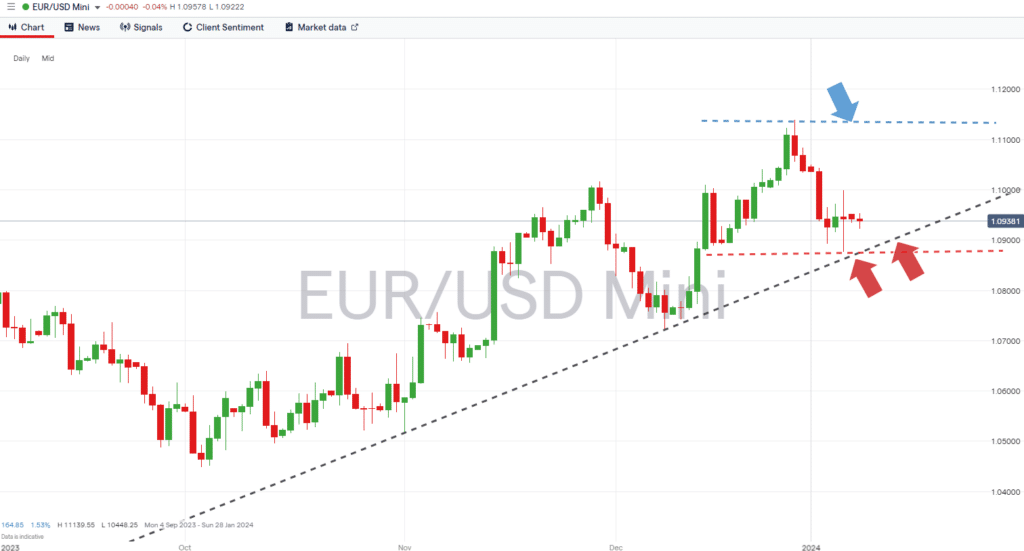
Price moves in EURUSD are as likely to be influenced by the US CPI report, which will allow investors to take a view of the USD leg of that currency pair. A break below Friday’s intraday low price of 1.08770 would represent a break of the supporting trendline, which has guided the price since November 2023 and could open the door to further euro weakness.
Daily Price Chart – EURUSD – Trendline support
Source: IG
The key number to watch: Thursday 11th January at 1.30 pm (GMT). US Consumer Price Index (CPI) inflation report: Analysts forecast inflation in December to have been 0.2% month-on-month and 4% year-on-year. Compared to 0.1% and 3.1%, respectively, in November.
Key price level: 1.08770 – Year-to-date price low printed on 5th January.
GBPUSD
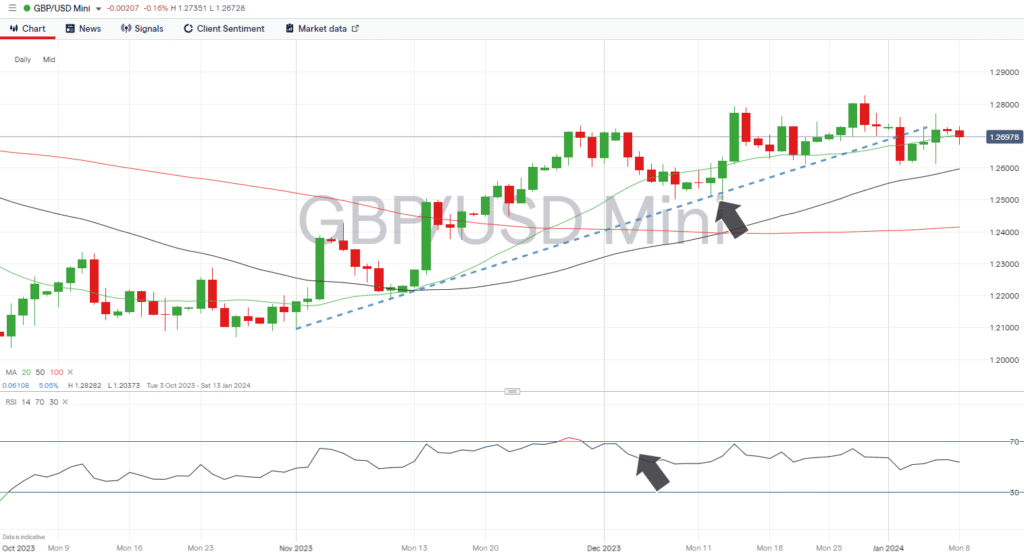
The release on Friday of UK GDP data for November can be expected to influence investor decisions on whether the sterling bull run that began in November can continue to build momentum. It comes after last week’s break of the supporting trendline, but the price of GBPUSD has held just below the upward price channel, suggesting that a breakback above the trendline can’t be ruled out. With the RSI on the Daily Price Chart at 53.3, there is little reason to consider the market either overbought or oversold, leaving room for the cable price to head in either direction.
Daily Price Chart – GBPUSD – Daily Price Chart – Upward price channel and mid-range RSI
Source: IG
The key number to watch: Friday 9th January at 7.00 am (GMT). UK GDP (November) – Analysts forecast national economic growth to be +0.1% up from -0.3% in October.
Key price level: 1.27030 – Region of the 20 SMA on the Daily Price Chart.
USDJPY
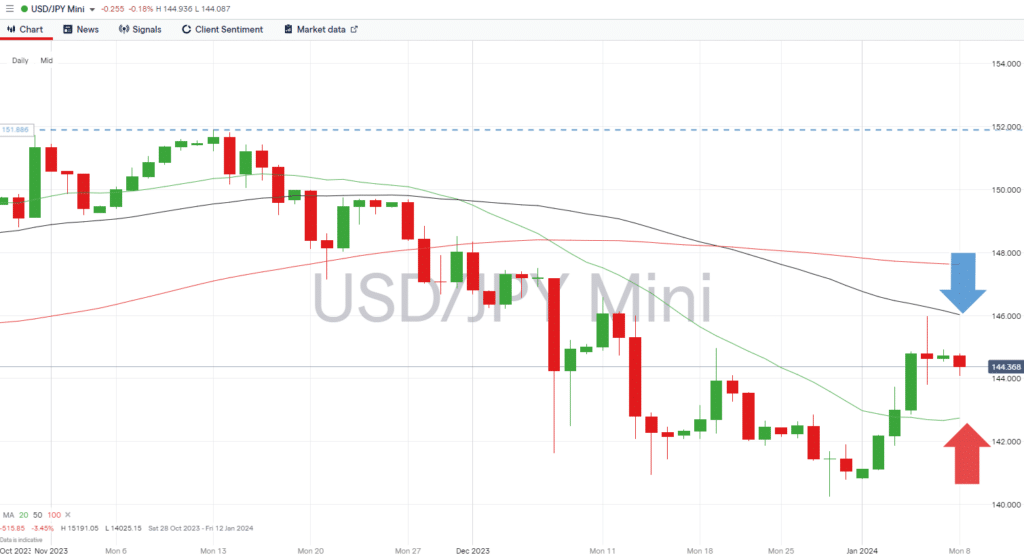
Traders of USDJPY face an interesting technical setup with price sitting mid-range between two key metrics. Last week’s price action saw price trade between (and test) the 20 and 50 SMAs on the Daily Price Chart. Until there is a break of either, the metric price could be funnelled into a narrowing channel thanks to the 20 SMA beginning to rise and the 50 SMA still plotting a downward trajectory. Should that period of price consolidation materialise, the next break out of the range could signal that a new trend has begun to form.
With little Japan-centric news due to be released this week, the most likely trigger of a breakout of the forming channel is the US CPI report, which is due to be released on Thursday. The fact that the RSI on the Daily Price Chart is generating a reading of 52.7 means that a period of sideways trading can’t be ruled out until that report is shared with investors.
USDJPY – Daily Price Chart – Mid-range between key SMAs
Source: IG
The key number to watch: Thursday 11th January at 1.30 pm (GMT). US Consumer Price Index (CPI) inflation report: Analysts forecast inflation in December to have been 0.2% month-on-month and 4% year-on-year. Compared to 0.1% and 3.1%, respectively, in November.
Key price level: 146.02 – Region of the 50 SMA on the Daily Price Chart.
Trade EURUSD with our top brokers:
| Broker | Features | Regulator | Platforms | Next Step | |
|---|---|---|---|---|---|
 Your capital is at risk
Founded: 2014 Your capital is at risk
Founded: 2014 |
|
FSPR | MT4 | ||
 Your capital is at risk
Founded: 2006 Your capital is at risk
Founded: 2006Europe* CFDs ar... |
|
ASIC, FSA, FSB, MiFID | MetaTrader4, Sirix, AvaOptions, AvaTrader, Mirror Trader | ||
 Between 74-89% of CFD traders lose
Founded: 2010 Between 74-89% of CFD traders lose
Founded: 2010Between 74-89 % of retail investor accounts lose money when trading CFDs |
|
ASIC, FCA | MetaTrader 4, MetaTrader 5, cTrader | ||
 51% of eToro CFD traders lose
Founded: 2007 51% of eToro CFD traders lose
Founded: 200751% of eToro retail investor accounts lose money when trading CFDs with this provider. You should consider whether you understand how CFDs work, and whether you can afford to take the high risk of losing your money. |
|
ASIC, CySEC, FCA | eToro Platform | ||
 Your capital is at risk
Founded: 2009, 2015, 2017 Your capital is at risk
Founded: 2009, 2015, 2017 |
|
ASIC, CySEC, IFSC | MT4 Terminal, MT4 for Mac, Web Trader, iPhone/iPad Trader, Droid Trader, Mobile Trader, MT5 | ||
 Your capital is at risk
Founded: 2006 Your capital is at risk
Founded: 2006 |
|
CySEC, DFSA, FCA, FSB, SIA | MetaTrader4, MetaTrader5, cTrader, FxPro Edge (Beta) | ||
 Your capital is at risk
Founded: 2011 Your capital is at risk
Founded: 2011 |
|
CySEC, FSCA, MISA | MT4, MT5, OctaTrader | ||
Risk Statement: Trading financial products carries a high risk to your capital, especially trading leverage products such as CFDs. They may not be suitable for everyone. Please make sure that you fully understand the risks. You should consider whether you can afford to take the risk of losing your money.


