- Risk appetite returns as investors weigh up the chances of interest rates having peaked.
- Australia’s interest rate decision on Tuesday will offer further clues regarding the approach taken by central banks.
- UK GDP figures due on Friday will shed light on the health of the global economy.
The release last week of the US Non-Farm Payroll jobs report, and the decision taken by the US Fed and Bank of England to keep interest rates unchanged could mark a significant moment in the 2023 trading calendar. It might be too early to talk of a ‘Santa Rally’, but even accounting for the weekly gain of 5.57% in the S&P 500 index, there is still room for upward movement in that key barometer of the financial markets, which is still trading almost 6% below the year-to-date high.
The coming week’s news releases are likely to have less impact on prices, and a ‘quiet’ week could allow upward momentum in risk-on currency pairs to continue to be the dominant theme. With key support and resistance levels coming into play, there is a possibility that price charts will reveal signs of new medium and long-term trends forming.
US Dollar
The decision by the US Federal Reserve to leave interest rates unchanged was accompanied by guidance from Fed Chair Jerome Powell, which triggered a return in risk appetite among investors. The last two meetings of the FOMC have been marked by members of the committee voting unanimously to hold interest rates at 5.25%, and traders now consider the hawkish momentum which drove repeated rate hikes to have drained away.
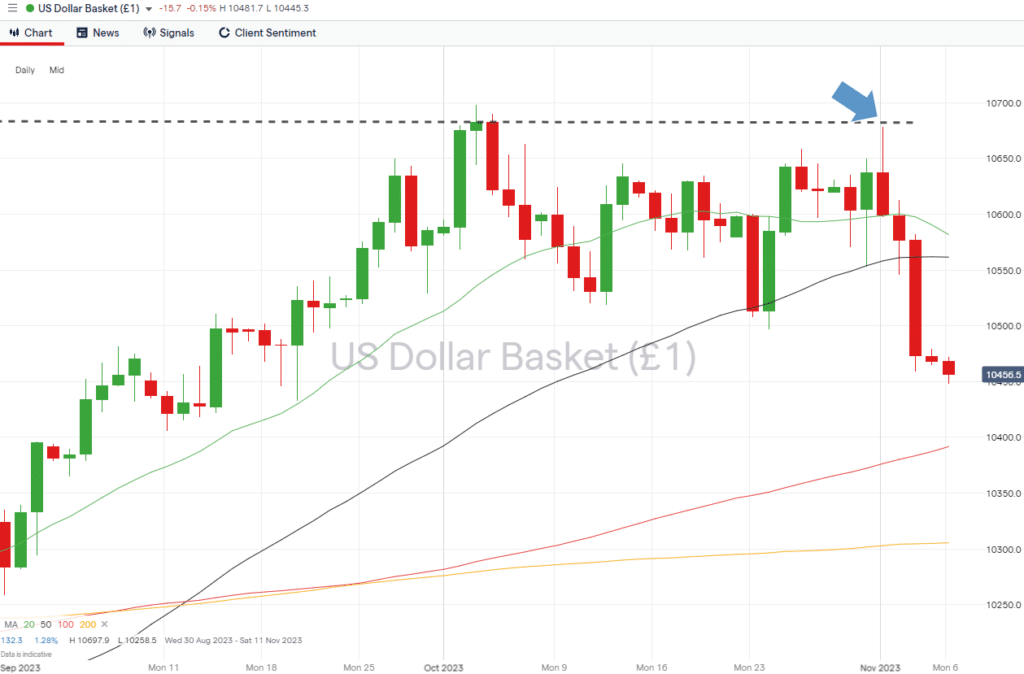
In response, the US dollar, regarded as a safe-haven asset, lost ground against other major currencies, with the US Dollar Basket index posting a weekly loss of 1.38%. With little US-specific news due to be released this week, few catalysts could trigger a rebound. That leaves price currently trading mid-range between two important long-term support and resistance levels. To the upside is the intra-day high of 106.78 recorded on Wednesday 1st November, and support comes in the form of the 20 SMA on the Weekly Price Chart (103.76), and below that, the convergence of the 50 and 100 SMAs in the region of 103.30.
US Dollar Basket Index – Daily Price Chart – Year-to-date highs and SMA Support
Source: IG
- The number to watch: Tuesday 7th November Reserve Bank of Australia interest rate decision at 3.30 am (GMT). While other central banks have held rates unchanged at recent meetings, Australian rates are forecast to rise to 4.35%.
- Key price levels: support in the region of 103.23 – 103.30, where the 50 and 100 SMAs on the Weekly Price Chart are converging.
EURUSD
Like the Fed and Bank of England, the ECB held interest rates unchanged at its most recent meeting. Given the sluggish state of the Eurozone economy, some traders are now tipping the ECB to be the first of the major central banks to start cutting rates. Despite the risk of euro interest rates falling in the near future, EURUSD posted a 1.68% gain last week, which points to the sell-off in USD currently being a more significant price driver.
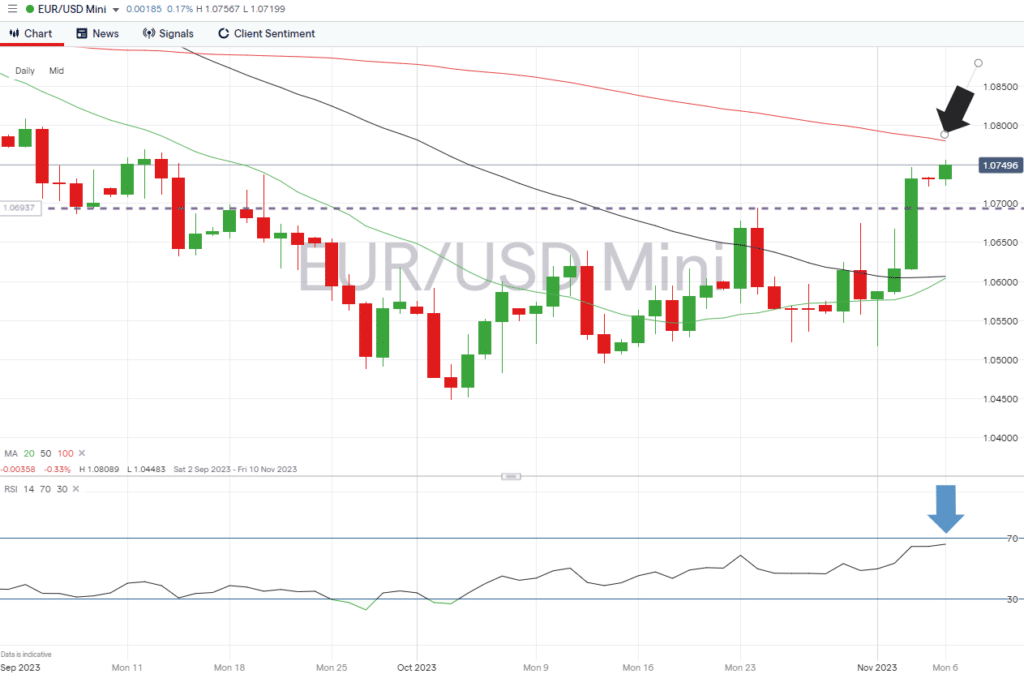
With little euro-specific data due out this week, price could be guided by technical support and resistance levels. The RSI on the Daily Price Chart is currently at 66.1, which leaves room for further upward price movement before the market is oversold on that timeframe; however, the 100 SMA can be expected to offer resistance in the region of 107.801.
Daily Price Chart – EURUSD – Daily Price Chart – RSI and 100 SMA
Source: IG
- The number to watch: Tuesday 7th November Reserve Bank of Australia interest rate decision at 3.30 am (GMT). Whilst other central banks have held rates unchanged at recent meetings, Australian rates are forecast to rise to 4.35%.
- Key price levels: resistance in the region of 1.07801. Price has, since mid-August, failed to break through the 100 SMA on the Daily Price Chart.
GBPUSD
The Bank of England’s decision to hold interest rates at 5.25% was widely anticipated, given the sluggish nature of the UK economy. Friday sees the release of the Q3 UK GDP numbers, allowing analysts to take a position on whether the Bank is likely to continue prioritising supporting economic growth over the risk of inflation.
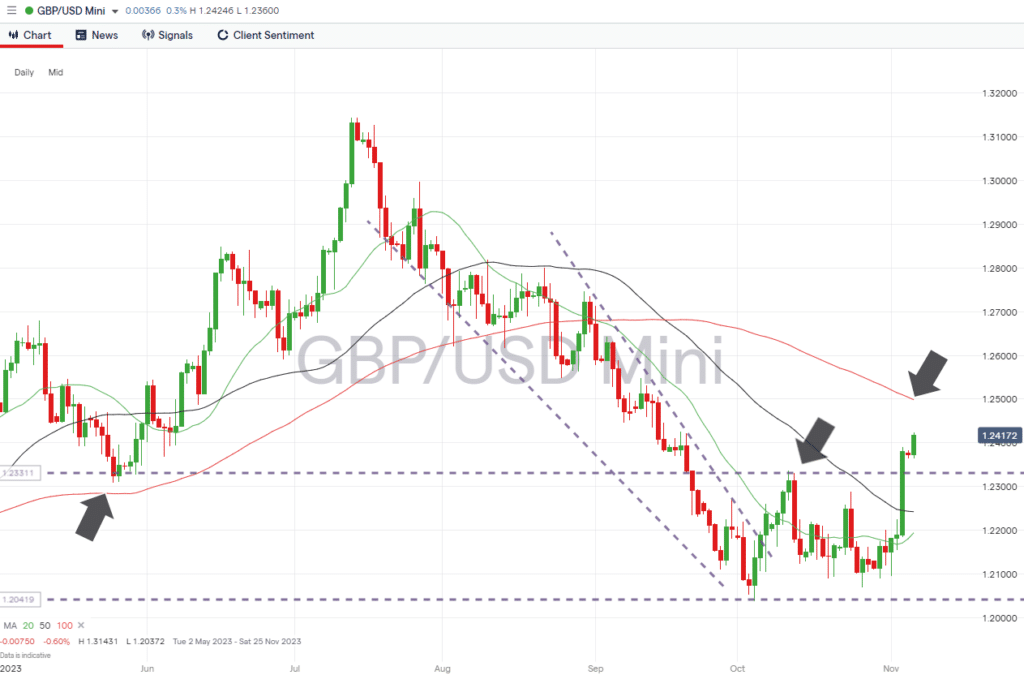
From a technical perspective, the break of the 1.23375 resistance level has brought GBPUSD into a new trading range. The resistance formed by the price high of 11th October can now be expected to offer support. That leaves room for the price of cable to rise and test the psychologically important 1.2500 price level, which is also guarded by the 100 SMA on the Daily Price Chart (1.24986).
Daily Price Chart – GBPUSD – Daily Price Chart
Source: IG
- The number to watch: Friday 10th November – UK GDP Q3 report 7 am GMT – Growth expected to be -0.1% quarter-on-quarter and -0.6% year-on-year.
- Key price level: 1.23375 – support level formed by the intraday price high of 11th October.
USDJPY
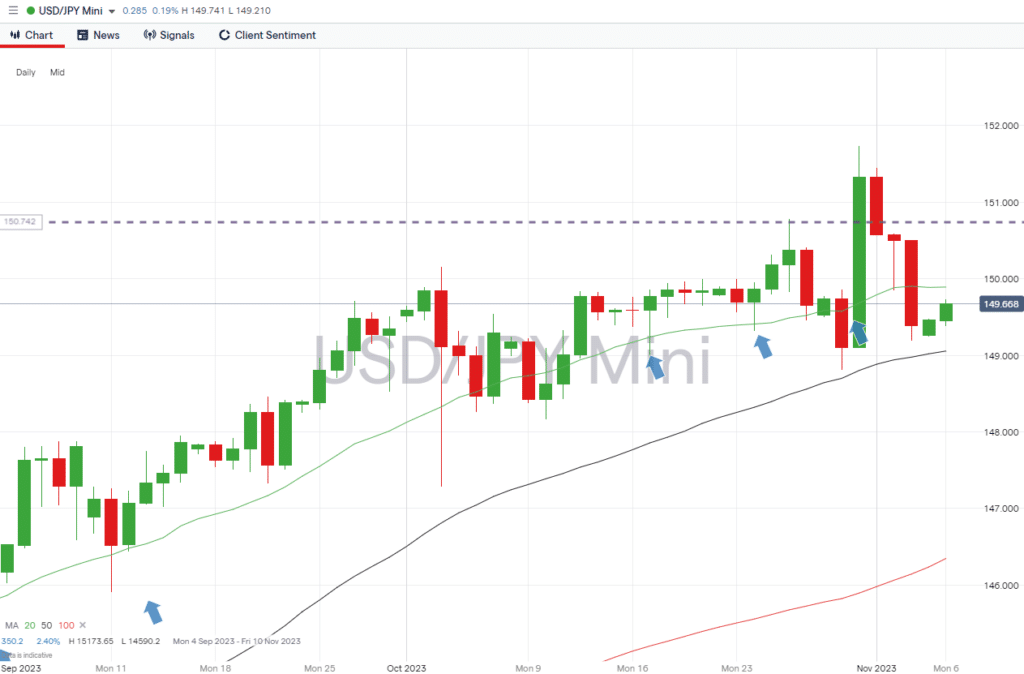
The price surge in USDJPY in the middle of last week saw the currency pair print a new year-to-date high. With the Fed seen as now adopting a more dovish stance and little Japan-focused news due to be released this week, a period of price consolidation below that key level could be likely.
USDJPY – Daily Price Chart
Source: IG
- The number to watch: Thursday 9th November – China CPI (October) 1.30 am GMT – Prices forecast to rise 0.2% year-on-year and 0.2% month-on-month.
- Key price level: 149.00 – region of the 50 SMA on the Daily Price Chart. Price has traded above this key metric since early August.
Trade EURUSD with our top brokers:
| Broker | Features | Regulator | Platforms | Next Step | |
|---|---|---|---|---|---|
 Your capital is at risk
Founded: 2014 Your capital is at risk
Founded: 2014 |
|
FSPR | MT4 | ||
 Your capital is at risk
Founded: 2006 Your capital is at risk
Founded: 2006Europe* CFDs ar... |
|
ASIC, FSA, FSB, MiFID | MetaTrader4, Sirix, AvaOptions, AvaTrader, Mirror Trader | ||
 Between 74-89% of CFD traders lose
Founded: 2010 Between 74-89% of CFD traders lose
Founded: 2010Between 74-89 % of retail investor accounts lose money when trading CFDs |
|
ASIC, FCA | MetaTrader 4, MetaTrader 5, cTrader | ||
 51% of eToro CFD traders lose
Founded: 2007 51% of eToro CFD traders lose
Founded: 200751% of eToro retail investor accounts lose money when trading CFDs with this provider. You should consider whether you understand how CFDs work, and whether you can afford to take the high risk of losing your money. |
|
ASIC, CySEC, FCA | eToro Platform | ||
 Your capital is at risk
Founded: 2009, 2015, 2017 Your capital is at risk
Founded: 2009, 2015, 2017 |
|
ASIC, CySEC, IFSC | MT4 Terminal, MT4 for Mac, Web Trader, iPhone/iPad Trader, Droid Trader, Mobile Trader, MT5 | ||
 Your capital is at risk
Founded: 2006 Your capital is at risk
Founded: 2006 |
|
CySEC, DFSA, FCA, FSB, SIA | MetaTrader4, MetaTrader5, cTrader, FxPro Edge (Beta) | ||
 Your capital is at risk
Founded: 2011 Your capital is at risk
Founded: 2011 |
|
CySEC, FSCA, MISA | MT4, MT5, OctaTrader | ||
Risk Statement: Trading financial products carries a high risk to your capital, especially trading leverage products such as CFDs. They may not be suitable for everyone. Please make sure that you fully understand the risks. You should consider whether you can afford to take the risk of losing your money.
