- US GDP report due out on Wednesday
- US Fed’s favoured inflation report, the US PCE follows on Thursday
- Asian markets set to be steered by release of a range of Japanese reports and China’s PMI reading
The risk-on approach adopted by investors through November took a break last week as forex prices consolidated in the region of key price levels. With the coming week’s news reports focussing on sentiment analysis and key Asian data points, prices in major currency pairs in the coming days look set to be influenced by announcements that are more nuanced. That could spell an extension to the sideways trading patterns influenced by US exchanges being closed for Thanksgiving or trigger a more substantial move if the background information points to a more significant global recovery.
US Dollar
The big news announcement for traders of dollar currency pairs comes on Wednesday when US GDP Q2 numbers are released. This second estimate is expected to show the US economy proving resilient and posting 4.9% growth on a quarter-on-quarter basis. That impressive estimate partly explains the recent shift towards bullish sentiment, but reports released on other days this week will allow traders to double-check their analysis.
On Monday, new US home sales data will be released. Followed on Tuesday by US Consumer Confidence for November, and PMI sentiment reports follow on Thursday and Friday. These reports don’t typically carry as much weight as interest rate decisions or unemployment reports. However, this week could be different thanks to investors scouring data releases trying to establish if the current bullish move is well founded. Thursday also marks the release of the Fed’s favoured inflation metric, the PCE price index, which often gives a better steer on what next steps Jerome Powell and his team might take.
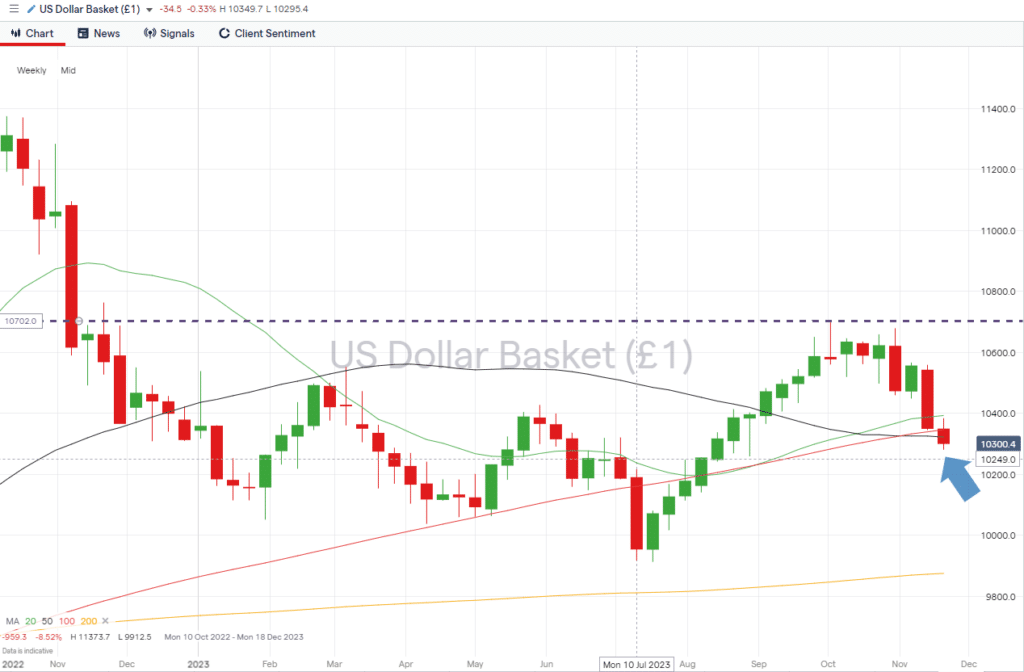
US Dollar Basket Index – Weekly Price Chart – Year-to-date highs and SMA Support
Source: IG
- The key number to watch: Wednesday 29th November at 1.30 pm (GMT). US GDP (Q2 Second Estimate) Analysts forecast growth to be 4.9% on a quarter-on-quarter basis.
- Key price levels: 103.21 The US Dollar Basket index is now trading below the 20, 50, and 100 SMA’s on the Weekly Price Chart. Without a confirmed break to the upside taking place, the path of least resistance continues to be downward.
EURUSD
Euro markets this week look set to be steered by important inflation data due to be released by Germany and France on Wednesday and Thursday, respectively. Thursday is also the day the November Eurozone inflation report is released. Last month’s Eurozone inflation reading was 2.9%, and any shift from that number will influence the decision-making of the ECB.
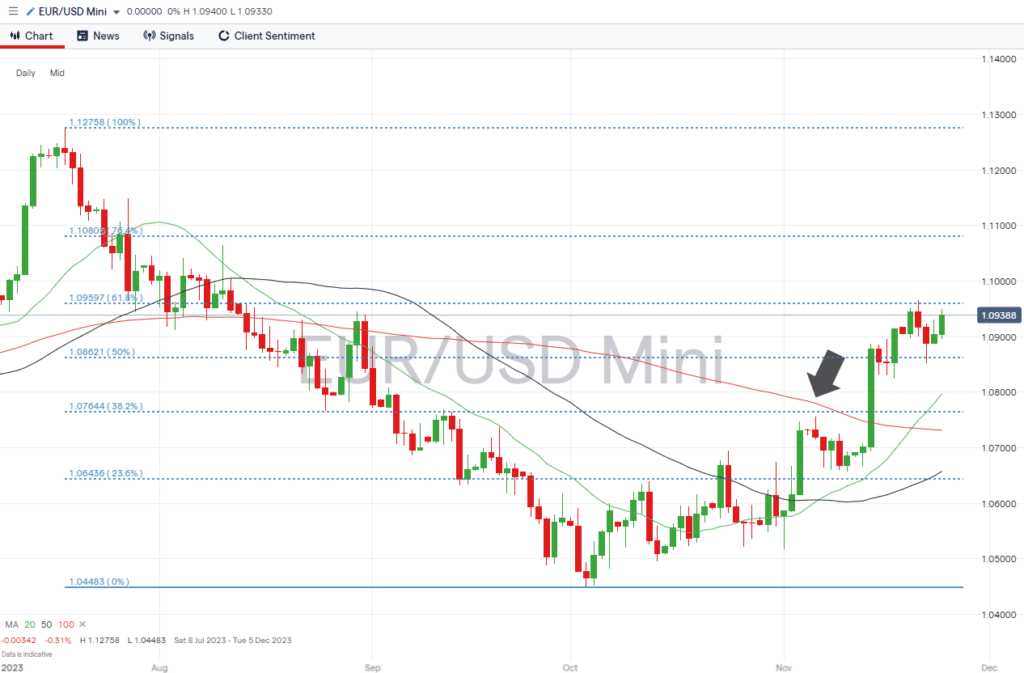
The rally in the euro, which started on 4th October, has brought the price of EURUSD to the 61.8% Fibonacci retracement of the price fall recorded between July and October. The resistance in the region of 1.09597 was tested on Tuesday, 21st October. There is yet to be a close above that key level, which sits just below the psychologically important 1.1000 round number price level.
Daily Price Chart – EURUSD – Fib retracement support/resistance levels
Source: IG
- The key number to watch: Thursday, 30th November, 10.00 am (GMT). Eurozone inflation report (November). Previous reading 2.9%.
- Key price levels: 1.09597 – resistance formed by the 61.8% Fib retracement.
GBPUSD
A quiet week in terms of UK-specific news flow will leave traders of GBPUSD responding to announcements out of the US. The US GDP Q2 set to be released on Wednesday will offer an insight into the relative strength of the UK and US economies and the likelihood of the Fed adjusting US interest rate levels to avoid the US economy overheating.
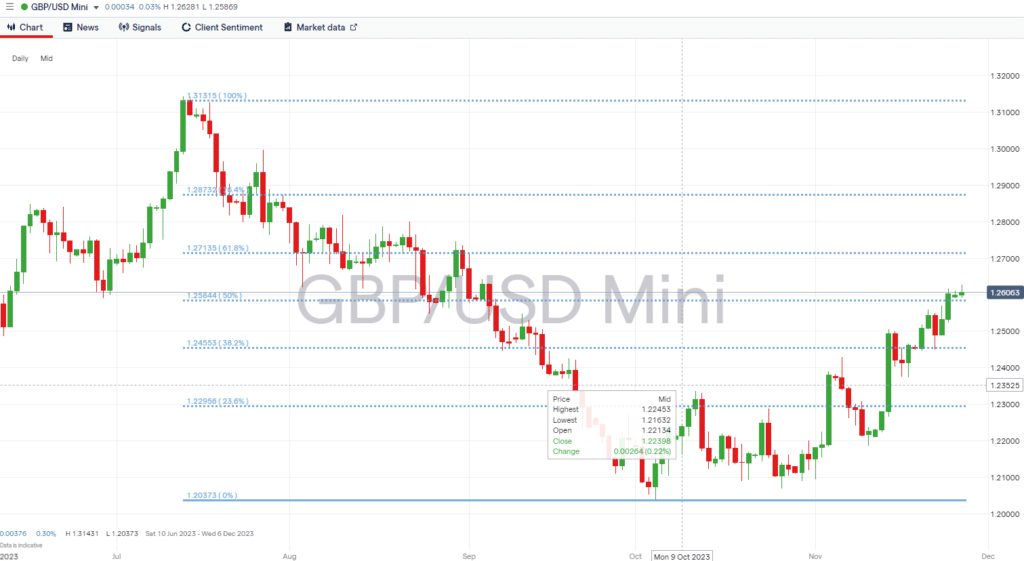
As with EURUSD, the price of GBPUSD has recently bounced to test a key Fibonacci level formed by the slump in price between July and October. Last Friday’s closing price of 1.26029 saw cable confirm its break of the 50% Fib level, which sits at 1.25884. As long as GBPUSD trades above that support level, there is room for further upward price movement, which is made easier by price currently trading above the 20, 50, and 100 SMAs on both the Daily and Weekly Price Charts.
Daily Price Chart – GBPUSD – Daily Price Chart
Source: IG
- Key numbers to watch: Wednesday, 29th November, 1.30 pm (GMT). US GDP (Q2 Second Estimate) Analysts forecast growth to be 4.9% on a quarter-on-quarter basis.
- Key price level: 1.25844 – Support offered by the 50% Fibonacci retracement level which previously acted as resistance to upward price moves.
USDJPY
The coming week looks set to be a busy one for traders of yen-based currency pairs. Reports are due on Japan’s industrial production, retail sales, unemployment, and consumer confidence. The China Caixin manufacturing index report, expected to be released on Friday, will also be closely monitored, given the importance of trade between the two countries.
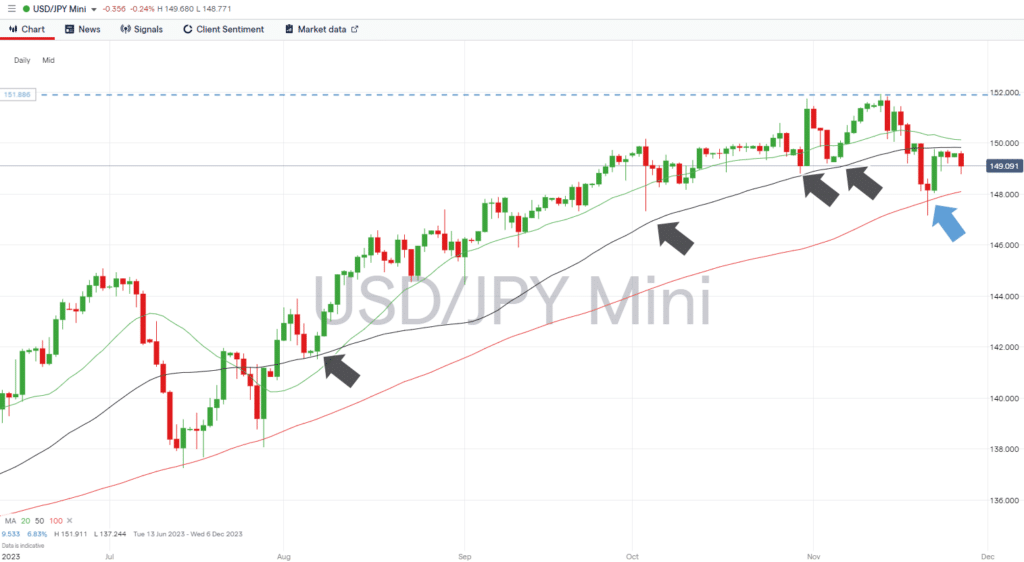
The 50 SMA on the USDJPY Daily Price Chart appears to be the key metric to watch. It guided the upward price move recorded between 31st July and 17th November but now provides resistance in the region of 149.81. With the psychologically important 150.00 price level also in play, traders will be looking for a catalyst to trigger renewed strength in dollar-yen. Without such an event, there is room for price to retest the 100 SMA support level, which sits at 148.09.
USDJPY – Daily Price Chart
Source: IG
- Key numbers to watch: Friday 1st December 1.45 am (GMT) – China Caixin manufacturing PMI (November). Forecast to rebound to 50.2 from 49.5 in October.
- Key price level: 149.81 – Region of the 50 SMA on the Daily Price Chart.
Trade EURUSD with our top brokers:
| Broker | Features | Regulator | Platforms | Next Step | |
|---|---|---|---|---|---|
 Your capital is at risk
Founded: 2014 Your capital is at risk
Founded: 2014 |
|
FSPR | MT4 | ||
 Your capital is at risk
Founded: 2006 Your capital is at risk
Founded: 2006Europe* CFDs ar... |
|
ASIC, FSA, FSB, MiFID | MetaTrader4, Sirix, AvaOptions, AvaTrader, Mirror Trader | ||
 Between 74-89% of CFD traders lose
Founded: 2010 Between 74-89% of CFD traders lose
Founded: 2010Between 74-89 % of retail investor accounts lose money when trading CFDs |
|
ASIC, FCA | MetaTrader 4, MetaTrader 5, cTrader | ||
 51% of eToro CFD traders lose
Founded: 2007 51% of eToro CFD traders lose
Founded: 200751% of eToro retail investor accounts lose money when trading CFDs with this provider. You should consider whether you understand how CFDs work, and whether you can afford to take the high risk of losing your money. |
|
ASIC, CySEC, FCA | eToro Platform | ||
 Your capital is at risk
Founded: 2009, 2015, 2017 Your capital is at risk
Founded: 2009, 2015, 2017 |
|
ASIC, CySEC, IFSC | MT4 Terminal, MT4 for Mac, Web Trader, iPhone/iPad Trader, Droid Trader, Mobile Trader, MT5 | ||
 Your capital is at risk
Founded: 2006 Your capital is at risk
Founded: 2006 |
|
CySEC, DFSA, FCA, FSB, SIA | MetaTrader4, MetaTrader5, cTrader, FxPro Edge (Beta) | ||
 Your capital is at risk
Founded: 2011 Your capital is at risk
Founded: 2011 |
|
CySEC, FSC, FSCA, MISA | MT4, MT5, OctaTrader | ||
Risk Statement: Trading financial products carries a high risk to your capital, especially trading leverage products such as CFDs. They may not be suitable for everyone. Please make sure that you fully understand the risks. You should consider whether you can afford to take the risk of losing your money.


