- Risk-appetite improves as banking sector concerns fade away.
- Proposed ‘reforms’ set to look very much like old laws which were recently repealed.
- The question remains: how to trade markets experiencing the application of a tried and tested band-aid.
An uptick in the price of risk-on assets, such as EURUSD, appears to show that investors are satisfied with the authorities’ reaction to the predicament of troubled banks, SVB, First Community Bank and Credit Suisse. On a week to date basis, EURUSD is up 0.61%, GBPUSD is up 0.85%, and the S&P 500 index has increased in value by 1.51%. With stronger fundamentals pointing to the path of least resistance being upwards, it is questionable which technical indicators offer appropriate long-position trade entry points.
How comprehensive are the banking reforms?
The recent banking crisis was triggered by events in the US. While reforms being put in place there still have to be rubber-stamped, the view seems to be that those reforms will be sufficient to restore investor confidence.
Plans being made by the White House are sensibly targeting mid-range banks, with assets of between $100bn and $250bn. There should also be little debate regarding the new controls, as it is likely that they’ll be very close in nature to the ones which were working well prior to former president Donald Trump repealing them.
A return to ‘business as usual’ for the US banking sector would be a significant boost for riskier assets. However, the question remains on how to enter into positions.
Technical Analysis
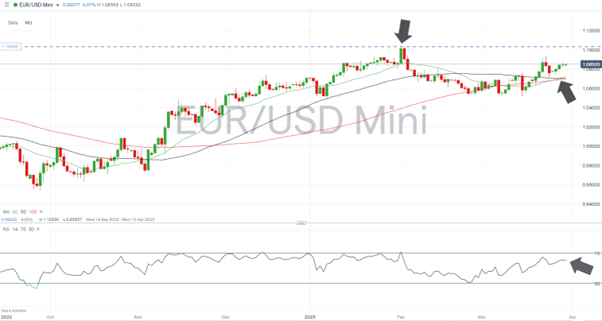
Focusing on EURUSD, we can see that we’re still in the short-term upwards move predicted in a report from last week. That rally could still run to the key resistance level of 1.10330, which is marked by the year-to-date high of 1st February. With the RSI on the Daily Price Chart at 61.1, there’s no reason to consider the market ‘overbought’ on that timeframe. At least, not yet.
EURUSD –Daily Price 2022-2023
Source: IG
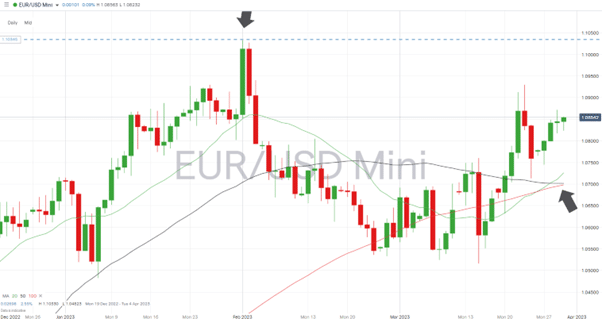
The major price support level on the Daily Price Chart is the 100 SMA. Any short-term weakness which takes price to the region of 1.06980, where that SMA sits, would represent a buying opportunity for those targeting the psychologically important ‘round number’ price level of 1.1000.
EURUSD – Daily Price Chart 2023 – 100 SMA
Source: IG
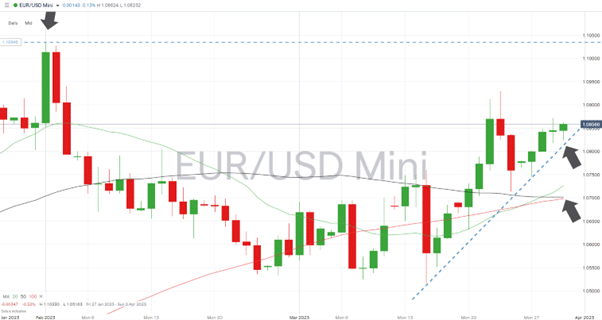
A more aggressive entry point would involve buying when the price of EURUSD retraces to the supporting trendline, of which dates back to the 15th of March. Currently in the region of 1.0820, a price move from there, to the target of 1.1000, would mark an almost 2% return. In that instance the 100 SMA could be used as a stop-loss.
EURUSD – Daily Price Chart 2023 – Trendline Support
Source: IG
People Also Read:
- The Week Ahead – 27th March 2023
- WEEKLY FOREX TRADING TIPS – 2023.03.27
- Short, Medium and Long-Term Forecasts for EURUSD Following ‘Dovish’ Fed Announcement
If you have been the victim of a scam, suspect fraudulent behaviour, or want to know more about this topic, please contact us at [email protected]


 Between 74-89% of CFD traders lose
  Your capital is at risk
  Your capital is at risk
  Your capital is at risk