- Jerome Powell’s dovish news statement has triggered more selling of the dollar
- Key long-term support levels are coming into play which suggests recent downward price moves may be overplayed
- With 13 days till the Fed announces its next interest rate decision, DXY’s 10500 support level is the one to watch
With just 13 days till the next announcement by the FOMC about US interest rates, the Chair of the FOMC has triggered the markets by revealing a more dovish stance.
On Wednesday, Jerome Powell reiterated that rates would be going higher. He also crucially suggested that December’s rate rise might not be in line with the super-sized hikes which have been such a feature of 2022.
Specifically, he said, “the time for moderating the pace of rate increases may come as soon as the December meeting.”
Powell’s comments triggered a rally in risk-on assets. The Dow Jones Industrial Index jumped 700 points, which equates to more than 2% in value. At the same time, the growth stock heavy tech index, the Nasdaq Composite, jumped 4.41% to 11,468.
Key Support For the Dollar at 10500
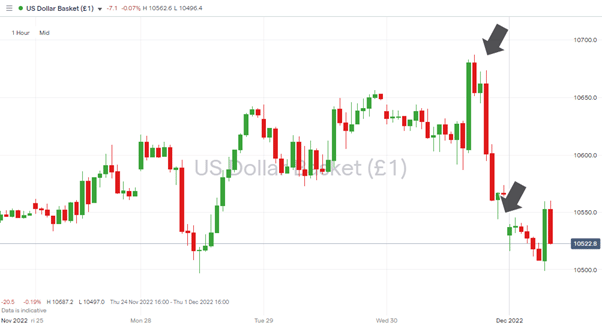
Powell’s comments also acted as a catalyst for further weakness in the dollar. The intraday move in the US Dollar Basket index from 10687 to 10543 represented a 1.34% fall in value in five hours. That’s a clear signal that the year-long trend of dollar strength could be over but looking at price moves over a longer time frame brings a key technical indicator into play.
US Dollar Basket index – Hourly Price Chart 30th Nov 2022 – Intraday Price Move
Source: IG
Also read: What is the USD Index?
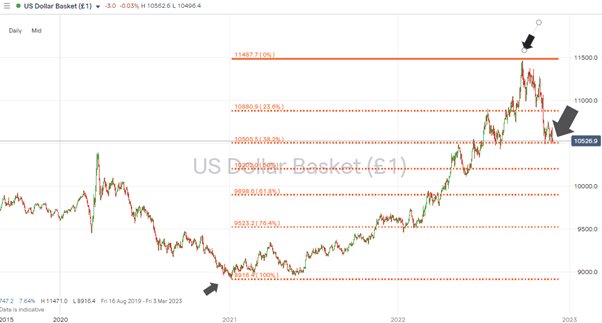
The dollar has been here before. Price tested the region of 10500 throughout the second half of November but failed to break below that support level. It’s still showing some reluctance to do so. That can be explained mainly by the 38.2% Fibonacci retracement of 10505, which dates back to 7th January 2021, when the index bottomed out at 8940.
US Dollar Basket index – Daily Price Chart 2020 -2022 – Fib Retracement
Source: IG
The 38.2% Fib looks like the critical metric to watch until the Fed meets again on 14th December.
A break to the downside opens up a further price fall to the region of the 50% Fib at 10202. That support level also sits in the region of another psychologically important round number price level.
If the 10500 support holds, there’s plenty of room for a bounce. The DXY price high of 11462 was posted as recently as 27th September and would be one obvious target for those buying the dip. Something which might be more tempting considering the rapid sell-off in USD has taken the RSI on the DXY Daily Price Chart to 34.1, which is borderline oversold.
People Also Read
- Sterling Outperformance Brings EURGBP Strategy Into Play
- Tracking GBPUSD’s Path Through The Trend Reversal
- The Best Performing Currency Pairs in October 2022
If you have been the victim of a scam, suspect fraudulent behaviour, or want to know more about this topic, please contact us at [email protected].
Sources:
https://www.dailyfx.com/news/us-dollar-sails-south-as-powell-puts-the-fed-case-forward-how-low-can-usd-go-20221201.html


 Between 74-89% of CFD traders lose
  Your capital is at risk
  Your capital is at risk
  Your capital is at risk