The ease with which EURUSD and GBPUSD just cut through key technical support levels raises the question of what next for both currency pairs? Buyers just stepped out of the way on Tuesday and Wednesday, and while a short-term rebound can’t be discounted, it looks like both forex pairs are heading to new ranges on the price chart.
The Eurodollar’s price crash between the start of the week and Wednesday’s close represented a 2.39% fall in value. The 1.52% slide in cable is obviously smaller in comparison, but forex market moves of that size are relatively rare.
Closing Below Year-to-Date Lows
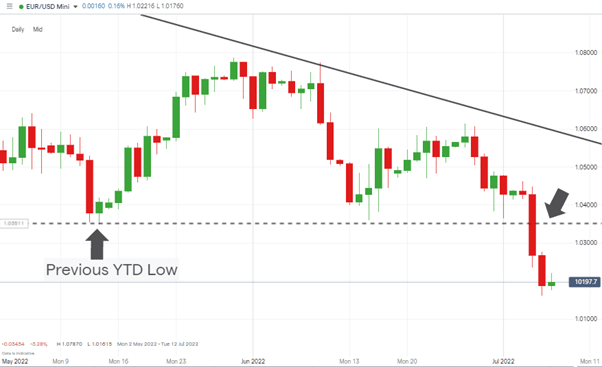
New key price levels have been created after both pairs closed below the previous year-to-date lows.
For EURUSD, the intraday slump to 1.03495 on 13th May 2022 was followed this week by the closing price on Wednesday 6th July being 1.02682.
EURUSD – Daily Price Chart – 2022 – New YTD Low Closing Price
Source: IG
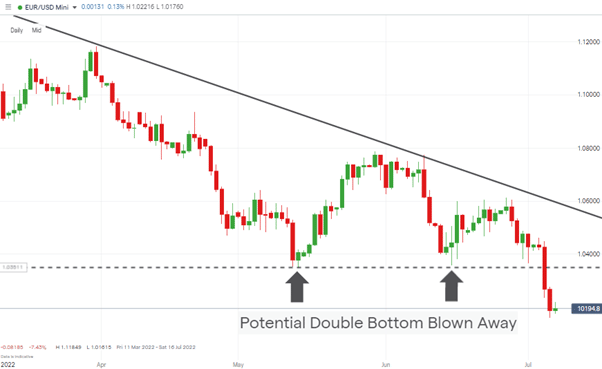
This is as much about the nature of the break to the downside as it is the price levels involved, with the big red candle on the Daily Price Chart suggesting die-hard fans of EURUSD finally capitulated and gave up on the idea of a double-bottom forming.
EURUSD – Daily Price Chart – 2022 – Potential Double-Bottom Wiped Out
Source: IG
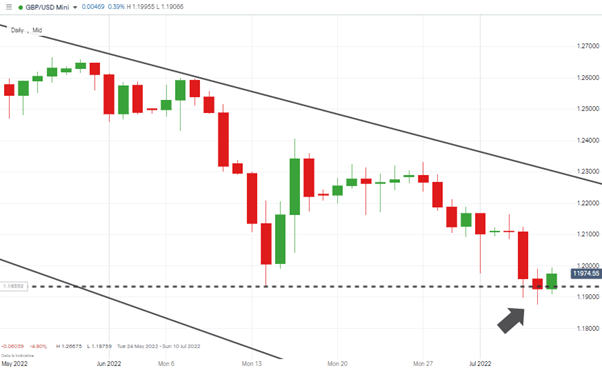
It was a similar story for sterling, with the slight difference being the moment the bulls gave up being Wednesday rather than Tuesday. Political uncertainty in Downing Street, and the very real chance of a change in prime minister being on the cards, acted as a catalyst for cable to move through the basement level support.
GBPUSD – Daily Price Chart – 2022 – New YTD Low Closing Price
Source: IG
What Are The Next Support Levels For Eurodollar and Cable?
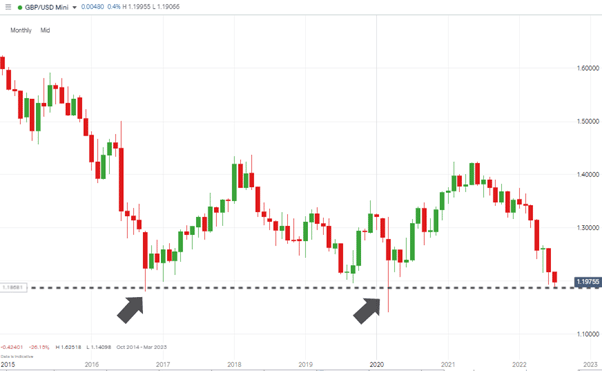
The feeling that both major currency pairs are entering uncharted territory is causing a hasty recalibration of price targets. The Monthly Price Chart illustrates how GBPUSD has only traded at levels as low as this on two occasions since 1990, the last one during the unprecedented events of the Covid pandemic of March 2020. The GBPUSD price low of 1.14098 that month is now the last remaining support level before cable really tests. It now looks likely that after cable has got this far that it will at least test that support.
GBPUSD – Monthly Price Chart – 1990 – 2022
Source: IG
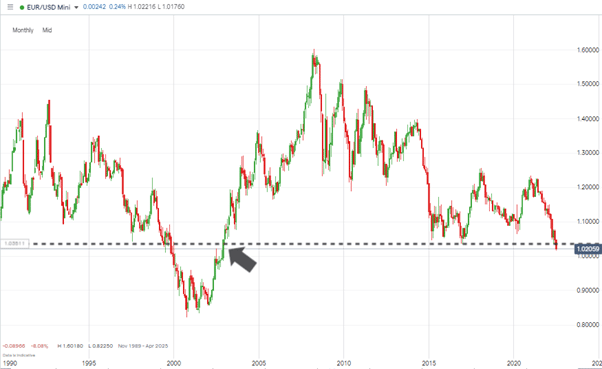
All bets are also off for EURUSD. The last time the Eurodollar traded near 1.02 was January 2003, and the all-time low of 0.837, printed in November 2000, is now coming into play.
EURUSD – Monthly Price Chart – 1990 – 2022
Source: IG
Some crucial fundamental analysis data points are coming into play, most notably the US Non-Farm Payroll jobs numbers due on Friday 8th July. Volatility can be expected to spike when that announcement is made, but without a daily close back above the previous year-to-date lows, it looks like the path of least resistance for both GBPUSD and EURUSD continues to be downward.
If you have been the victim of a scam, suspect fraudulent behaviour, or want to know more about this topic, please contact us at [email protected]
 Between 74-89% of CFD traders lose
  Your capital is at risk
  Your capital is at risk
  Your capital is at risk