As expected, the GBPUSD ‘Brexit Trade’ and US Fiscal Stimulus discussions continue to be the major talking points in the markets.
Bonds
The bond dealing desks have a reputation for knowing what is really going on, so it was interesting to see US government debt prices were slightly higher on Thursday morning. Risk-off being the confirmed mood in the market.
The negotiations between Treasury Secretary Steven Mnuchin and House Speaker Nancy Pelosi over a COVID fiscal stimulus package are not progressing at the rate some would hope.
Just after the opening of the European bourses (9:15 a.m. CET) the yield on the benchmark 10-year US Treasury slid to 0.8126%. Longer-dated bonds also went the same way with the yield on the US 30yr T-Bill falling to 1.6175%.
Equities
Mirroring the move in fixed income markets the pan-European Stoxx 600 dropped as much as 1% in the first hours of European trading.
Equity indices are now some way underwater on a week-to-date basis:
- Invesco STOXX Europe 600 UCITS ETF = -2.79%
- DAX Index = -3.67%
- FTSE 100 = -2.46%
Given the scale of the recent price move and a lack of any immediate catalysts, it could be that the bad news is priced in at these levels.
One sector particularly badly hit was auto manufacturers. The Lyxor STOXX Europe 600 Automobiles & Parts UCITS ETF is having a volatile time. With Thursday’s session yet to reach the halfway mark, the peak to trough intra-day prices are 3.56% away from each other.
GBPUSD
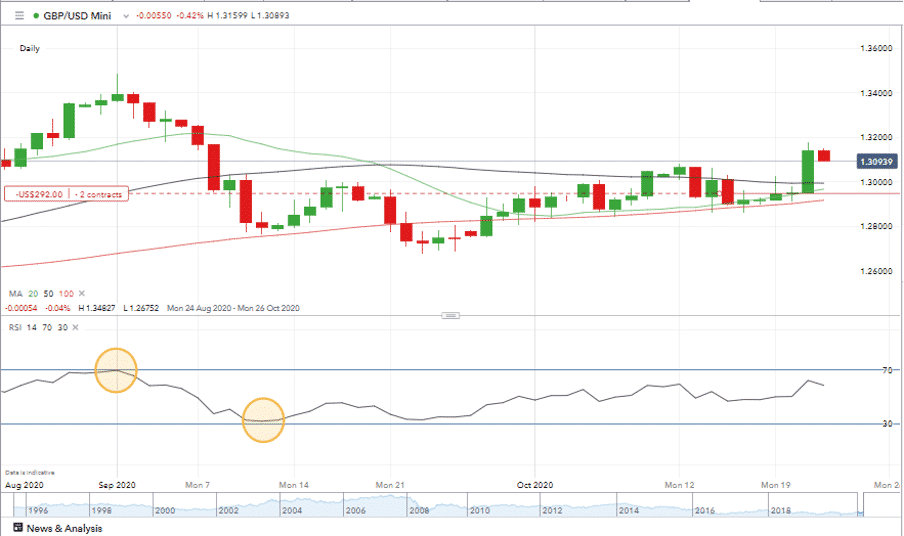
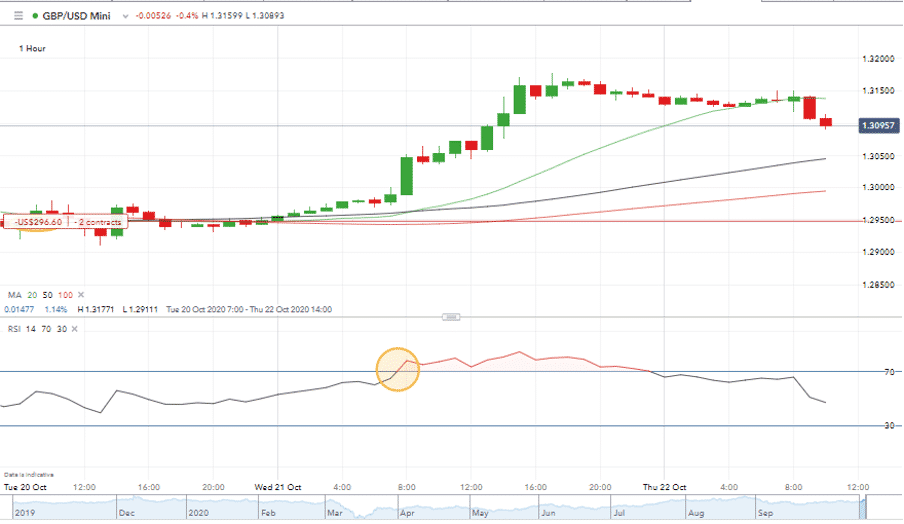
Part of the reason for additional volatility in the auto sector is the continued uncertainty over Brexit trade talks between the EU and the UK.
It’s hard to rely too heavily on technical analysis when political one-liners can cause a shift in price.
One notable factor being that the Daily rather than the Hourly RSI is proving more effective at picking trade entry and exit points.
Source: IG
Bitcoin
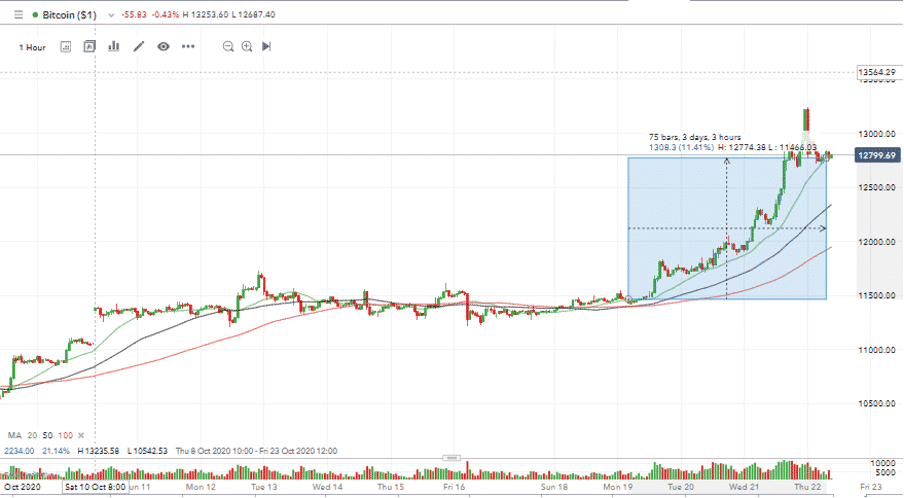
Meanwhile, as is often the case, Bitcoin has been doing its own thing. Our analysis of the 15th of October “It’s $12,000 Time For Bitcoin” picked out the building groundswell of momentum. The move to higher prices beat our estimate and the weekly high is now $13,235.
The spike in price on Thursday morning could mark a period of price consolidation. It might be too late to join in this particular bull run as BTC is already up over 11% on the week. More active traders may well be taking profits at these levels which mark yearly highs.
Source: IG
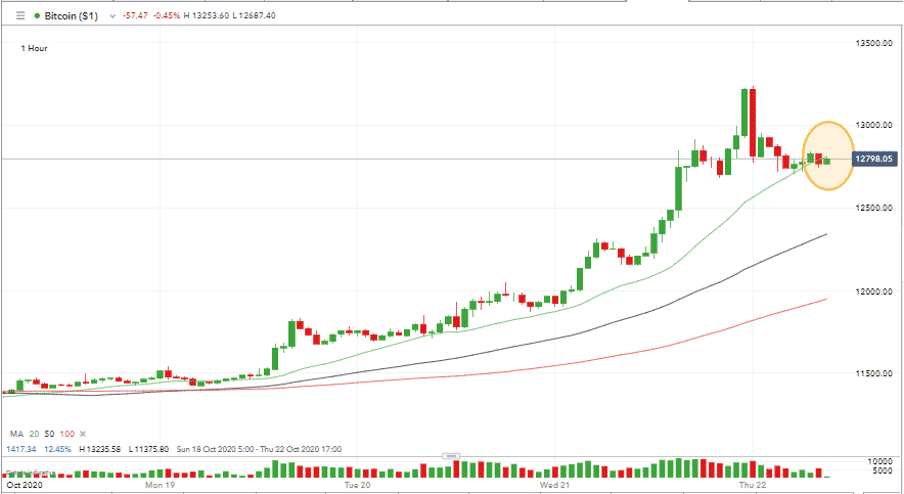
The line of people who sold out of Bitcoin too early is a very long one. The Hourly chart shows that mid-way through Thursday’s European session the Hourly 20 SMA is providing support even at these levels.
Source: IG
FOMO is a substantial element of Bitcoin dealing. Our research which picked out the forming rising wedge pattern highlighted that some who were looking to go long might wait for a pull-back to $11,000 before entering a trade. If they did follow that approach in this instance, they certainly missed out.
Our analysis is based on a comprehensive summary of market data. We use a range of metrics with weighting given to simple and exponential moving averages and key technical indicators. Any information contained on this Website is provided as general market information for educational and entertainment purposes only, and does not constitute investment advice. The Website should not be relied upon as a substitute for extensive independent market research before making your actual trading decisions. Opinions, market data, recommendations or any other content is subject to change at any time without notice. ForexTraders will not accept liability for any loss or damage, including without limitation any loss of profit, which may arise directly or indirectly from use of or reliance on such information.
PAST PERFORMANCE IS NOT NECESSARILY INDICATIVE OF FUTURE RESULTS.


 Between 74-89% of CFD traders lose
  Your capital is at risk
  Your capital is at risk
  Your capital is at risk