- Forex price moves are making the news in the mainstream as well as financial press agencies reporting on the ground-breaking developments
- The holding pattern formed over the last week reflects traders preparing for US inflation data reports due to be released Thursday
- Will the CPI data result in a continuation of the trend, or is this the bottom?
Mainstream media channels have picked up on the whipsawing price action in currency markets. That means that the public in London, Frankfurt, and Tokyo are being treated to headlines that detail the US dollar’s ground-breaking moves.
The price moves have been dramatic, taking EURUSD to parity, GBPUSD to lows last seen in the 1980s, and USDJPY appears to be on a limitless upward cycle. Geopolitical events ranging from the Russia-Ukraine conflict to the UK’s infamous mini-budget have brought the currency markets to a wider audience. However, at a time when there is increased public interest, price action has taken a breather.
The holding patterns formed in EURUSD and GBPUSD this week represent a moment when prices appear to be readying to start their next trend. There’s no guarantee that the months-long trend will continue, but with crucial CPI inflation data due to be released in the US, it looks like we are about to find out.
Major Currency Pairs and 20 SMA
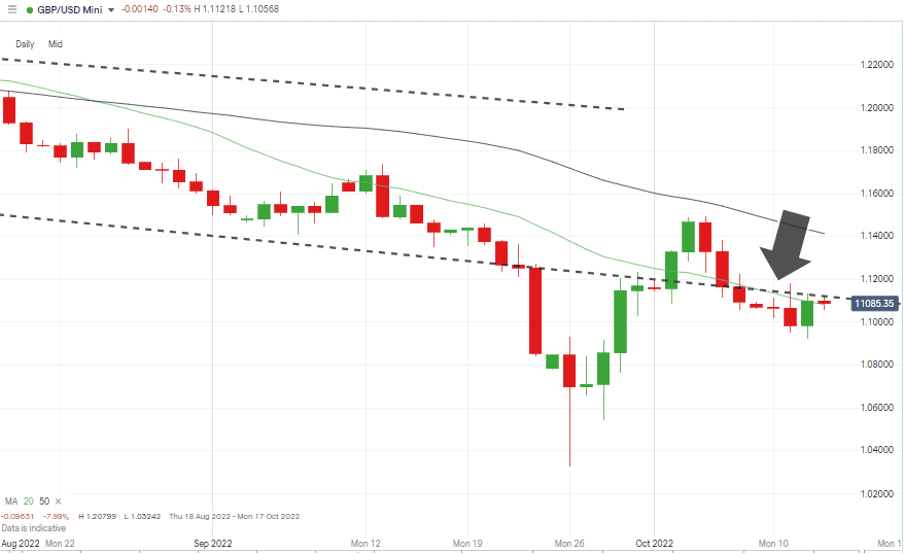
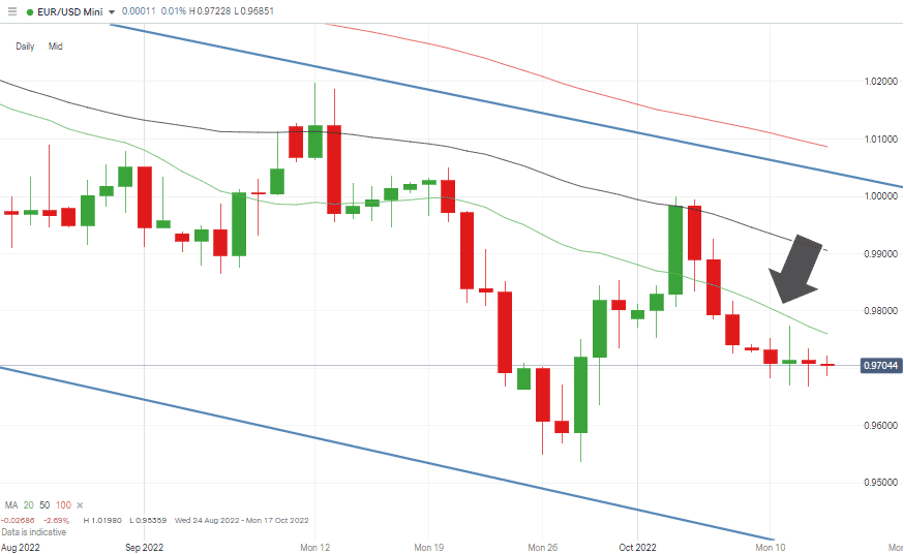
GBPUSD and EURUSD have, over the last week, traded in line with the 20 SMA on the Daily Price Chart. This conservative move reflects the significance of the upcoming US inflation report due at 8:30 EST on 13th October.
GBPUSD Daily Price Chart – Holding Pattern on 20 SMA
Source: IG
Also Read: GBP/USD Technical Analysis
The actions of Vladimir Putin and Liz Truss’ new government may have brought forex prices to their current levels, but the CPI report looks set to determine the next move.
For those considering this moment to possibly be the bottom of the market, there is little chance of the 20 SMA providing significant resistance if there are hints in the CPI report that inflation may be on the wane.
In that instance, the 50 SMAs and upper trendlines of the downward price channel would likely come into play in a short space of time.
EURUSD Daily Price Chart – Holding Pattern on 20 SMA
Source: IG
Those with a more bearish outlook will be looking out for news that inflation is still out of control and preparing for a sudden move towards the year-to-date lows. Sellers of cable will target 1.03242, printed on 26th September, and euro-dollar traders will have 0.95359, printed on 28th September, in their sights.
It is a busy news week, but the technical price levels look set to also play their part in determining if any strategy is successful.
People Also Read
- The Best and Worst Performing Currency Pairs in September 2022
- Forex Explained – What Are Major Forex Pairs?
- Investors See First Sign That Cycle Of Higher Interest Rates Might Be Slowing
If you have been the victim of a scam, suspect fraudulent behaviour, or want to know more about this topic, please contact us at [email protected]


 Between 74-89% of CFD traders lose
  Your capital is at risk
  Your capital is at risk
  Your capital is at risk