So goes Oil, so goes the Loonie, a phrase that most Canadians are tired of hearing. But the last twelve months have not been good for petroleum products, and, in the process, the Loonie has fallen like a crippled bird in flight, unable to get its wings to cooperate. The “buckshot” of a declining global economy has beaten down crude oil prices to such a degree that analysts regard it is a coin toss as to what direction it will go in the near-term future. The Canadian economy is also floundering, as buckshot flies to and fro.
One recent headline screamed, “Ignore Goldman Sachs And Their Bombastic $20 Per Barrel Crude Oil Prediction,” while many more optimistic analysts suggest that a bottom has formed and that crude oil prices will rise from $45 to $60 per barrel by the end of the year. Which prediction is the correct one? Time will tell, but Goldman did predict that Gold would collapse a few years back, and it did. Was that bombastic luck or skill?
The opposing argument is based mainly on an interpretation of logic-based facts, rather than “bombastic-ness”. The current givens are that OPEC will produce more; Russia and Iran will keep on pumping, while U.S. production will fall. The final piece of the puzzle is what will China do? Yes, the Chinese economy has been in freefall lately and the focus of concern by many, including the IMF, but they continue to import seven million barrels of oil daily. Are they using it now or stockpiling it for the future?
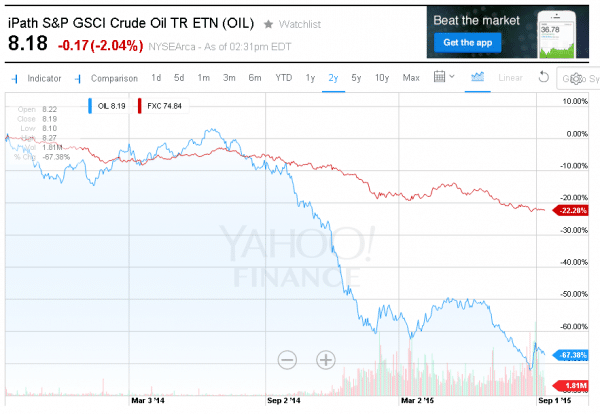
The ordeal of oil, however, has seriously impacted the Canadian Dollar, as depicted below in this return comparison format:

The two dance partners in the above diagram (the “Red” line is an ETF for the CAD versus the USD, and the “Blue” line is a popular oil futures ETF) were tripping the light fantastic for most of 2014, entwined in their commodity-based correlation two-step. When the bottom fell out of oil prices, the race was on to find new support levels. The market is trying to form a new bottom, but Goldman is not convinced. As for the last twelve months, while oil prices fell 57%, the Loonie declined 17%, not exactly a one-to-one relationship, but a clear enough one to use for future reference purposes.
Based on current forecasts, what could the “USD/CAD” pair be at yearend?
Crude oil is currently around $45 a barrel. The “USD/CAD” pair is presently in a tight range about a 1.325 mean. If we take the $60 and $20 predictions for oil prices and do the math on a direct relationship basis, then we can at least establish high and low boundary limits for the following discussion. First, the topside – For $60 oil, that is a 33% increase, which would translate into a currency adjustment of 9.8%, or a value of 1.195. On the low side for oil – For $20 oil, a 44.4% decline would equate to a 13.1% decline, for a value of 1.499.
To put each of these values in perspective, we need only check on the yearend forecasts from a few of the largest banks in Canada. As quarter end approaches, the foreign exchange departments for these banks are actually revising their estimates for the remainder of 2015, as well as for valuations out into 2016 and beyond. As of their last publication date, a selection of these values ranged between 1.26 and 1.30, as of December 31, 2015. It is also interesting to note that forecasts for 2016 converge upon 1.24 to 1.25, a gradual strengthening move as the global economy picks up steam, and commodity prices, including those for oil, recover to higher levels.
What is really going on behind the scenes with oil prices?
Oil market pundits have had a field day writing both positive and negative articles about the travails of Black Gold. We are now into “Silly Season”, so to speak, in that it is more difficult to attract the attention of the public. Most of us have tired of the many “The-sky-is-falling” scenarios. Yes, it was nice to have low-priced gasoline during the summer travel season, but our dependence on oil and its many petroleum derivatives is not about to disappear anytime soon. Even Goldman admits in its doomsday prognostication, a worst-case scenario, by the way, that the current fundamentals for oil are improving.
The press, however, thrives on sensationalism. When you dig a little deeper into the Goldman announcement, their estimates are meeker than the press would have you believe. According to Bloomberg, “Goldman trimmed its 2016 estimate for West Texas Intermediate to $45 a barrel from a May projection of $57 on the expectation that OPEC production growth, resilient supply from outside the group and slowing demand expansion will prolong the glut. The bank also reduced its 2016 Brent crude prediction to $49.50 a barrel from $62.” Goldman foresees a glut and a longer re-balancing period.
What are the current fundamentals? Here are a few facts to consider:
- The International Energy Agency’s (IEA) previous report for August noted that, “Global oil demand revised up from previous report; fastest pace in five years.” Yes, demand is increasing, but it is still being overwhelmed by supply. As a result, the IEA contemplates the “process is likely to be prolonged as a supply overhang is expected to persist through 2016 – suggesting global inventories will pile up further.”
- In its most recent report for September, the IEA announced that, “The latest tumble in the price of oil, which hit a six-year low in August, is expected to cut non-OPEC supply in 2016 by nearly 0.5 million barrels per day (mb/d) – the biggest decline in more than two decades.” Lower output in the United States, Russia and North Sea is contributing to this decline, a quickening of the re-balancing cycle that the oil industry is enduring at present. As one analyst put it, “The Saudi-led cartel’s master plan to pump record amounts of oil in order to squeeze other producers out of the market appears to be working.”
- As margins fall and OPEC exporting countries continue to feed the supply glut, U.S. oilrig counts have dropped more than 50%. This precipitous decline can only speak to reduced supply in the future, a good thing when it comes to oil prices going forward.
- On the political front, a heat up in Middle East tensions always has a severe impact on oil supply-chain dynamics. Whether or not hostilities in the region will throw the proverbial monkey wrench into current estimates is anyone’s guess at this time, but analysts warn that near-term supply forecasts are based on a best-case scenario. Any disruption at all could bring back higher oil prices.
As both the IEA and other analysts have pointed out in article after article, “Crude Oil Is Seeing Improving Fundamentals.” The present situation is on the mend, but it will be a rocky road to absolute re-balancing, the reason being that net short positions are running as high as they were last March. Short-covering rallies back then fueled a 40% bump up in prices on a whim. A similar situation now exists. Volatility will persist, $60 oil can easily be achieved if the shorts begin to waver. Timing is the real issue.
What is really going on behind the scenes with the Canadian economy?
The Canadian economy is heavily dependent on oil and mining exports, but it is also closely tied to the economic goings on down in the lower forty-eight states, as well. Canada is “Number Two” in oil exporting nations, right behind Saudi Arabia, and roughly half of its exports, including oil, are destined for the United States. Based on the first two quarters for 2015, Canada could technically be termed to be in recession, but, with GDP growth figures of a negative 0.2% and 0.1%, respectively, the dreaded “R” word could be reserved for later, based rounding errors alone.
The Bank of Canada, like many other central banks, has been lowering interest rates to weaken its currency and thereby encourage more export traffic. The jobs picture has been favorable, but unemployment rates appear to be bottoming out. At its meeting last week, the BoC decided to pass on another reduction. It noted that, “Economic activity continues to be underpinned by solid household spending and a firm recovery in the United States, with particular strength in the sectors of the U.S. economy that are important for Canadian exports…While the overall export picture is still uncertain, the latest data confirm that exchange rate-sensitive exports are regaining momentum.”
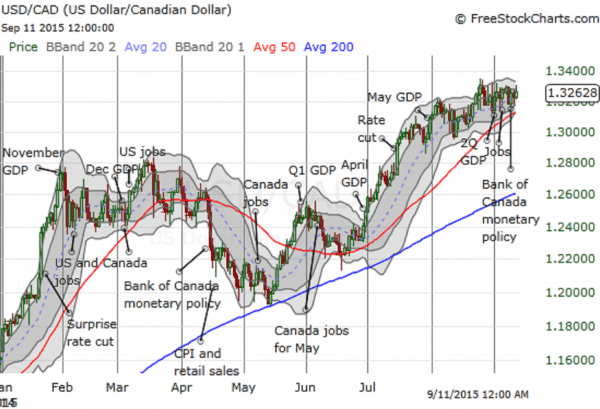
The Loonie did not react to these and other assertions that it would take time for a recovery to stabilize. The following chart notes previous movements:
Like other major pairings, the “USD/CAD” is currently trapped within a tight range, awaiting the Fed’s decision on interest rates on the 17th. Whatever decision is made, expect amplified volatility. For a reversal to take shape, prices need to close below the 50-Day average, the “Red” line on the chart, and then test and penetrate previous support levels.
Concluding Remarks
It seems inevitable that the Loonie will get a new pair of wings in the future. The only question is when. It has swooped extremely low over the past year, and it still may have more low to go, but a gradually improving economy, both domestic and global, should help re-balance oil supplies and prices, a boon for Canada in the long run. What has gone down must come up at some point.
How does one profit on this forecast for the future? If you are into stocks, experts suggest buying the big five — Exxon Mobil, ConocoPhillips, BP, Chevron, or Royal Dutch Shell. As veteran forex traders will tell you, there is no money to be found by trying to predict a bottom or a top in any market. Be patient enough to wait for a real trend to develop after the reversal, then jump on and ride.
The Loonie’s descent has been a long one, and a great opportunity for those that jumped on that trend. The ride up will be rocky. Short covering rallies will persist and ensure that volatility is the name of the game, but this ride should be just as profitable. We doubt if “parity” with the greenback, as it was back in 2012, is in the cards, but we could get close. Stay tuned!

 Between 74-89% of CFD traders lose
  Your capital is at risk
  Your capital is at risk
  Your capital is at risk