Last week Facebook (NASDAQ: FB) was shedding investors due to leaked information from the whistle-blower Frances Haugen being shared in the public domain. On Monday, the share price offered some relief when it closed 2.53% higher on the back of positive earnings figures for Q3. The governance concerns remain, but Monday’s share price activity proved that for investors at least, making money never went out of fashion.
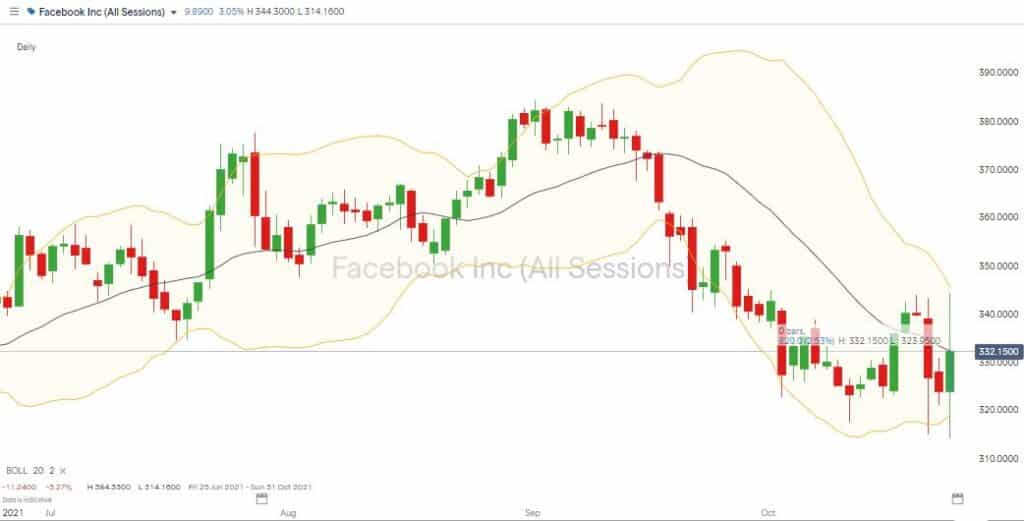
Facebook Share Price Chart – Daily with Bollinger Bands
Source: IG
The closing price for Facebook was $332.15, which is right on the centre line of the Bollinger bands (20) and the price action since Mid-Sep can only be described as bearish thanks to the gradual fall from $380. Is this the start of price bottoming out in the region of $330 before picking up speed?
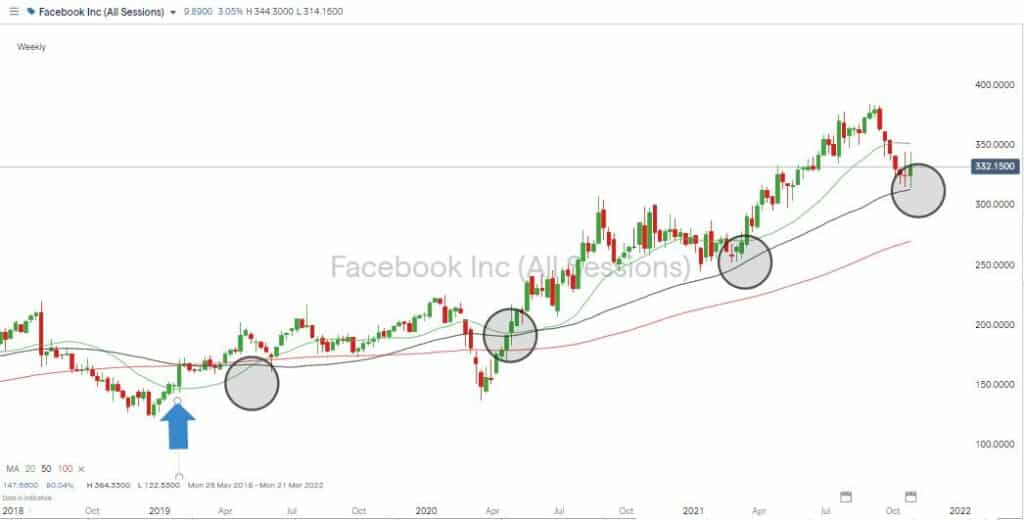
Facebook Share Price Chart – Weekly with Bollinger SMA Support
Source: IG
The weekly price chart for Facebook shows how important the 50 SMA has been in that timeframe. Since 2019, the only period in which price closed below the Weekly 50 SMA was during March 2020 – the epicentre of the Covid-19 pandemic.
With the weekly 50 SMA currently sitting at $312.85, there is a chance for bottom fishers of the stock to ease into a long position and set a stop loss below a significant support level which is only somewhere near $20 away from the entry price.
The potential upside includes the following price targets:
- Weekly 20 SMA at $351.36
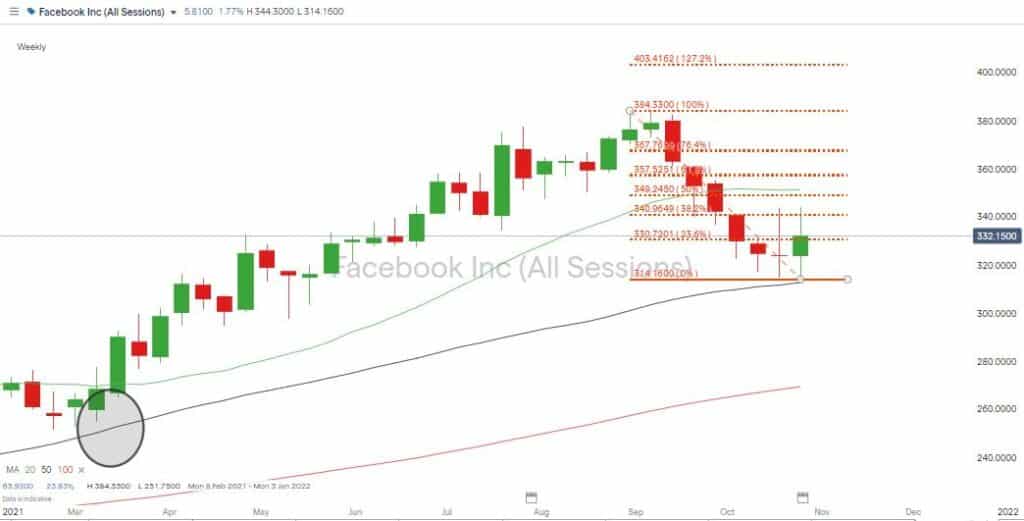
- 50% Fib retracement of the recent sell-off at $357.52. This position is a third key resistance level near the ‘big number’ psychologically important price level of $350
- Further up the price chart sits $384.33 – an all-time high posted in the last week of August – before tech’s big September sell-off
Facebook Share Price Chart – Weekly with Fib Retracement
Source: IG
Facebook’s market cap of $912bn positions it as one of the big players in the global stock markets. An 18.26% slide in value over the last 56 days is not unheard of, nor is it a common occurrence for a stock of that size.
The power and influence of the firm can’t be understated. That has traditionally been seen through the lens of client privacy issues, but the firm flexed a different kind of muscle on Monday. It announced that it is about to engage in a $50bn stock buy-back programme, and that wall of cash appears to put a limit on the amount of further downward stock price movement.
The tech sector is a volatile place at the moment. While the S&P 500 and Dow Jones Industrial Average index closed at record highs on Monday, the Nasdaq 100 is still to reach that important target. If September and October represent just a bad couple of months for tech stocks, then now is the time to pick up positions in some of the laggards – an opportunity that hasn’t arisen with much frequency in the last few years.
If you have been the victim of a scam, suspect fraudulent behaviour, or want to know more about this topic, please contact us at [email protected]


 Between 74-89% of CFD traders lose
  Your capital is at risk
  Your capital is at risk
  Your capital is at risk