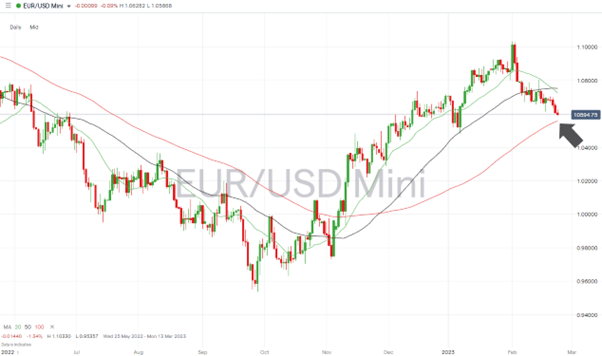
- EURUSD looks set to test the key 100 SMA on the Daily Price Chart.
- Buying pressure can be expected in the region of 1.0558.
- Potential trade set-up comes on the back of Fed minutes springing few surprises.
Since the beginning of February, price action in the US dollar market can only be described as “bullish.” However, the release of the latest Federal Reserve FOMC minutes has resulted in the greenback taking a break from its upward trajectory.
Whether this marks a period of price consolidation or the beginning of a reversal is a tricky question to answer. Still, with EURUSD approaching a key support level, buyers of the euro could be planning to step back into the market.
Fed Minutes Match Analyst Expectations
The Fed’s multi-month programme of aggressive interest rate hikes clearly identified inflation as the organisation’s primary target, but there are now suggestions that Jerome Powell and his team could manage to pull off a “soft landing” for the US economy.
The minutes of the last FOMC meeting were released on Wednesday, still sticking to the script of further interest rate hikes being in the pipeline. Markets are currently pricing in rises of 25 basis points in March, May and June. The committee also continued to reference the target rate of inflation being 2% and concerns that, currently, inflation is “well above” that level.
At face value, more dollar strength can be expected. Still, with price rises possibly starting to ease, there is a suggestion the Fed might try and not only tame inflation but also help the US economy avoid a recession.
Also Read: EURUSD Forecast and Live Chart
EURUSD Reaching Key Support Level
One view is that future rate hikes are already priced in and that the Fed is ‘talking a good game’ but could adopt a more dovish approach in the future. That brings an interesting technical analysis set up in the EURUSD market into play.
EURUSD – Daily Price Chart 2022 – 2023 –Test of 100 SMA?
Source: IG
EURUSD has traded above the 100 SMA since 10th November 2022. The absence of even a test of that key metric over a period of months raises the possibility of a bounce of some sort, even if a complete reversal doesn’t occur.
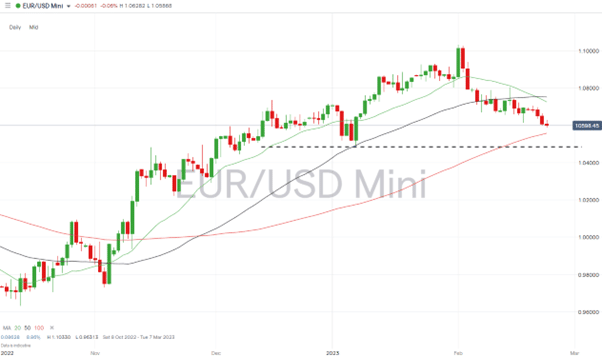
Day traders, scalpers, and those trading longer-term strategies will watch the price as it moves closer to the current SMA price range of 1.05580. The swing-low formed on 6th January when price reached as low as 1.04822 is another significant support level. A break of that would be a sign that bears have control of the market which means it will be a popular price level for stop-losses on long positions.
EURUSD – Daily Price Chart 2022 – 2023 – Swing Low
Source: IG
People Also Read:
- The Week Ahead – 20th February 2023
- Disconnect Between Forex and Stock Markets Points Towards Increased Volatility
- The Week Ahead – 13th February 2023
If you have been the victim of a scam, suspect fraudulent behaviour, or want to know more about this topic, please contact us at [email protected]


 Between 74-89% of CFD traders lose
  Your capital is at risk
  Your capital is at risk
  Your capital is at risk