- EURUSD sell-off has so far failed to signal the end of the October to February bullish price pattern
- US Jobs data to be released on Friday 10th March
- Surprises in the Non-Farm Payroll report could take EURUSD to important Fib-based, long-position trade entry points.
One of the most important economic data reports of the month will be released on Friday 10th March when the US Non-Farm Payroll unemployment numbers are released. In the build-up to the critical announcement, EURUSD is tracking a familiar pattern and establishing a position just above key price points.
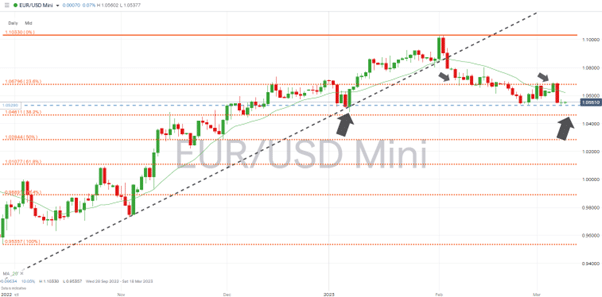
EURUSD – Daily Price Chart 2022 – 2023 – Trendline and Fib Retracement
Source: IG
Also Read: EURUSD Forecast and Live Chart
Is the Euro Ready to Bounce?
Despite the recent sell-off in EURUSD, which started on 1st February, the bullish trend, which dates back to 28th September 2022, remains intact. The move from lows of 0.95357 to 1.10330 included a psychologically important break of the parity price level on 26th October. Another indication of the strength of upward momentum is that over four months, price only closed below the 20 SMA on the Daily Price Chart on three days.
As long as price continues to trade above the swing-low price level of 1.04823 recorded on 6th January, the price chart will show a classic bullish formation – of higher highs and higher lows.
Any surprises in the Non-Farm Payroll number could blow the euro off course and in either direction, but there are key price levels which could guide it.
Key Fibonacci Price Levels Coming into Play
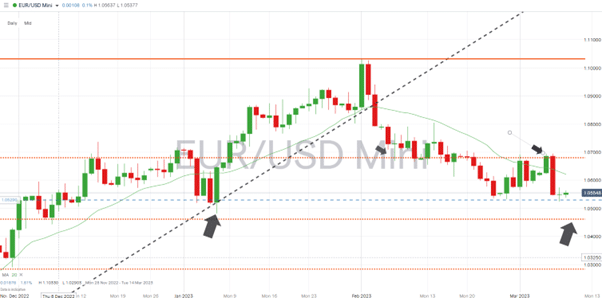
The first major price level to look for is the 38.2% Fibonacci retracement of the October to February price rise, which sits at 1.04611. There are reasons that the Fib level could provide considerable support. Not only does it sit just below the January swing-low price level of 1.04823, but its fellow indicator, the 23.6% Fib level (1.06796), acted as a significant price guide between 7th February and 7th March, first acting as support and then resistance.
EURUSD – Daily Price Chart 2022 – 2023 – 23.6% and 38.2% Fib Retracement
Source: IG
If Fib indicators are to continue influencing price to such an extent, then a buy trade at 1.04611, with a price target of 1.06796, would capture a nice-to-have 2.13% price move. The scenario would require the NFP jobs number to provide enough volatility for a short-term price drop before bullish momentum resumed. It would also result in a momentary break of the January swing-low price level, which might reduce the potential for further gains.
People Also Read:
- WEEKLY FOREX TRADING TIPS – 2023.03.06
- The Best and Worst Performing Currency Pairs in February 2023
- Forex Market Forecast for March 2023
If you have been the victim of a scam, suspect fraudulent behaviour, or want to know more about this topic, please contact us at [email protected]


 Between 74-89% of CFD traders lose
  Your capital is at risk
  Your capital is at risk
  Your capital is at risk