The new trading year kicks off with a large number of data releases to work through. There are reasons to think the news releases due this week could be particularly important in steering the direction of the market. As many institutional investors will be returning from a period of being away from their desks, they will use news and data releases to ease their way back into the markets.
The ‘big number’ is going to be the US unemployment data due for release on Friday. The broad consensus is that the Non-Farm Payrolls number will be disappointing. That could throw up an opportunity to join in one of the long-term trends – the demise of the US dollar.
USD Basket – Trading the Blips
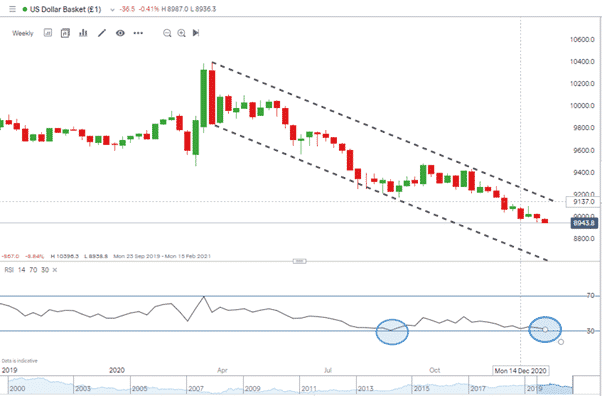
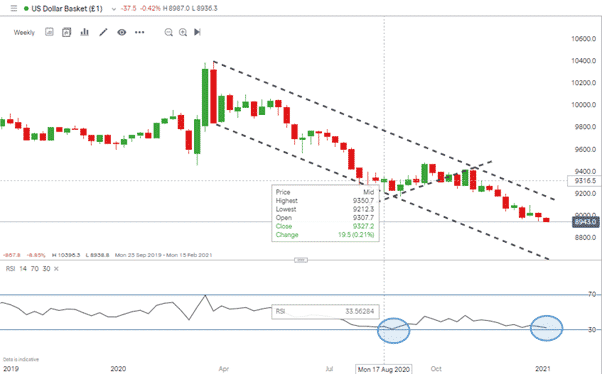
For several months there has been a significant increase in short positions in the USD Basket index / DXY index. The weekly candle chart from IG outlines the distinct downward channel.
Source: IG
The dollar’s status as a safe-haven asset has worked against it as investors have piled into riskier asset groups since March 2020. The speed with which some firms embraced the societal changes, and set themselves up to make future profits out of the new way of doing things, gave the bulls room to flex their muscles.
Those who anticipate that trend continuing might find that the USD payroll data due on Friday provides an opportunity to get into or build up their short USD positions. If the numbers aren’t as bad as expected, there could be a short-term reversion and a chance to enter into short positions.
The question is not how bad the Non-Farm payroll numbers will be?
There is much focus on the December number, but it’s worth noting that the number released on Friday shouldn’t be considered in isolation. The rally in riskier assets has hidden the fact that the US job market has been suffering death by a thousand cuts.
November’s result was disappointing. The US economy added 245,000 jobs in that month, a figure well below the market’s expectation of 469,000.
That, in turn, followed the October figures which had initially been welcomed by the bulls but were subsequently revised downwards from 638,000 to 610,000 additional jobs. The number of jobs added in September was 672,000. Even before the second-wave of COVID infections kicked in, the number of new jobs being added each month was on the slide.
(Source: US Bureau of Labor Statistics)
RSI – Is DXY oversold on a short-term basis?
The RSI on the weekly chart is reaching the same near-30 levels last seen in August 2020. At that time, DXY rallied for ten weeks, and while failing to break out to the upside, it did move from the lower to the upper end of the channel.
Source: IG
A resurgence in coronavirus cases and uncertainty over the recovery of the US ‘main-street’ economy could offer a short-term reversion in the USD’s slide. If price does spike to the top end of the downward channel, short-sellers will likely step back into the market.


 Between 74-89% of CFD traders lose
  Your capital is at risk
  Your capital is at risk
  Your capital is at risk