- Dollar rally triggered by blowout US jobs numbers for January
- Fed Chair Jerome Powell is keeping his cards close to his chest
- Key technical metrics could help determine if the dollar is about to start another run
When announcing his latest interest rate hike on Wednesday, 1st February 2023, US Federal Reserve Chair Jerome Powell advised the markets that US employment was increasingly becoming the metric that would determine future US interest rate policy.
Two days later, the Non-Farm Payroll (NFP) numbers were published, revealing that 572,000 new job openings were created in January, the biggest monthly surge in employment since July 2022 and way above analyst predictions of 187,000.
USD Strength on Strong Fundamentals
With the US economy showing such strength from a fundamental analysis perspective, the US Dollar basket posted a daily gain of 1.09% on Friday, 3rd February 2023. It continued its bull run into the following week. Rising employment leads to increased consumer spending and more inflation, which would result in US interest rates being set higher for longer.
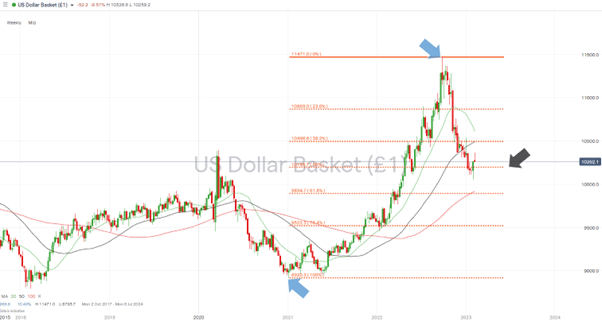
The upward move by the US Dollar basket index to trade between 102.00 – 103.00 makes complete sense but brings the dollar’s price to a significant technical analysis inflection point. That key metric is the 50% Fibonacci retracement of the USD rally that started on 7th January 2021 and topped out on 28th September 2022.
Also Read: What is the USD Index?
US Dollar Basket index – Weekly Price Chart 2020 – 2023 – 50% Fibonacci Retracement
Source: IG
Following the release of the NFP jobs numbers, some have raised the idea that January’s red-hot jobs report is a misleading blip – and Powell himself has since suggested he’s going to take a watch-and-wait approach. Speaking with Carlyle Group Chairman David Rubenstein on Tuesday 7th February, Powell explained he saw signs that inflation was cooling. The Fed remained on guard but was not going to divert from its current path.
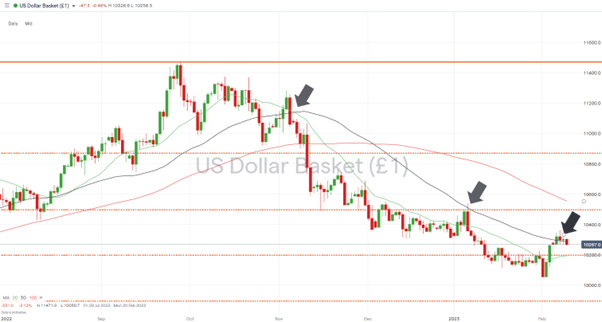
US Dollar Basket index – Daily Price Chart 2020 – 2023 – 50 SMA
Source: IG
That could be interpreted as Powell continuing to keep all options open to him, something he has shown he is keen to do. But if the price on the Daily Price Chart for the US Dollar Basket index breaks through 102.84, that would demonstrate traders concluding that a more hawkish policy will need to be adopted by the Fed.
The 102.84 price level marks the region of the 50 SMA on the Daily Price Chart of the US Dollar Basket index. That metric has steered the course of the DXY index’s downward move, which started on 4th November 2022. A confirmed break above that level would represent a significant shift in investor sentiment.
People Also Read:
- The Week Ahead – 6th February 2023
- The Dollar Takes a Breather
- Powell Reveals What is Guiding US Interest Rate Policy
If you have been the victim of a scam, suspect fraudulent behaviour, or want to know more about this topic, please contact us at [email protected]


 Between 74-89% of CFD traders lose
  Your capital is at risk
  Your capital is at risk
  Your capital is at risk