- Price moves in forex and stock markets show how currency and equity investors view risk differently.
- The US dollar’s rally points to a rush towards the security of a safe-haven asset.
- At the same time, major stock indices are posting new highs.
When two markets diverge from long-term price relationships, something ultimately has to give. The question for traders now is whether it is the upward move in the US dollar or the rally in stocks which is the odd one out.
USD Breakout
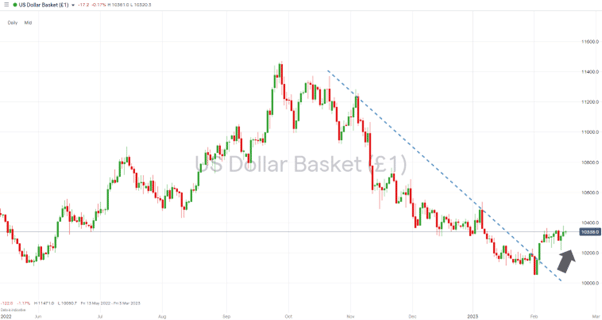
Strength in the US Dollar Basket index in February has resulted in it posting a 3.23% month-to-date increase in value.
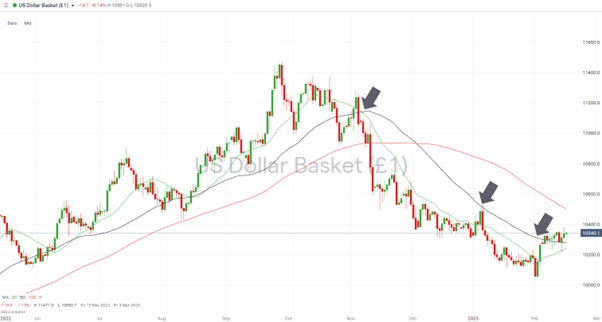
That move has also resulted in the DXY index breaking two key resistance levels. The first is the multi-month trendline dating from November 2022; the second is the 50 SMA on the Daily Price Chart – a metric of which price has been failing to close above since 4th November of last year.
US Dollar Basket index – Daily Price Chart 2022 – 2023 – Trendline Break
Source: IG
US Dollar Basket index – Daily Price Chart 2022 – 2023 – Break of 50 SMA
Source: IG
From a fundamental analysis perspective, the move can be attributed to signs that the US economy is still overheating and that the US Federal Reserve will increase interest rates further. That improved rate of return would make the dollar more attractive to international investors and push up the price of the greenback.
The most recent Non-Farm Payrolls jobs report saw employment in January jump by 517,000, whereas analysts had predicted a move of 187,000. The unemployment rate in the same report was found to be at almost a 53-year low.
Inflation data this week is also pointing to further interest rate hikes. Tuesday’s US CPI inflation report established that prices in January increased by 0.5% and were up 6.4% on a year-on-year basis. Again, higher than the market had expected.
Also Read: How is Volatility Calculated for Forex Pairs?
Stock Rally
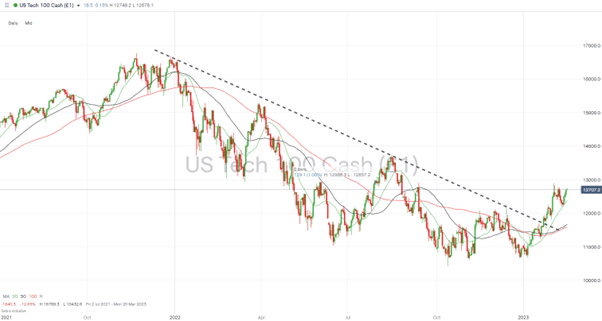
At the same time, risk-on assets such as US tech stocks have been rallying. The boom in the US economy can only explain that on a short-term basis, as higher interest rates and inflation are bad news for medium and long-term stock valuation. The major bloodletting in the stock market in 2022 was driven by concerns about future earnings being downgraded and decreasing stock valuations based on conventional models.
NASDAQ 100 Index – Daily Price Chart 2020 – 2023 – Break of 50 SMA and Trendline
Source: IG
Of course, many will be looking to buy the recent dip in the stock markets. Even after the recent rally, the NASDAQ 100 is still trading 23% below the highs of November 2021.
The question is whether the current move is a false dawn for equity investors. With forex markets not supporting the stock market moves, it does appear to be more of a short-term retracement rather than a sign of a longer-term shift in risk appetite.
People Also Read:
- The Week Ahead – 13th February 2023
- Dollar Tests Key Inflection Point – Stick or Twist for the Greenback
- The Dollar Takes a Breather
If you have been the victim of a scam, suspect fraudulent behaviour, or want to know more about this topic, please contact us at [email protected]


 Between 74-89% of CFD traders lose
  Your capital is at risk
  Your capital is at risk
  Your capital is at risk