- GBPUSD hits low price levels not seen for decades as budgetary fears spark a run on the pound
- Key technical indicators which were coming into view and offering support were blown away by the price crash.
- With the pound in uncharted territory, what next for GBPUSD?
The GBPUSD exchange rate had already been under pressure for several weeks. Just at the point where a range of technical indicators suggested it might be about to change direction, new UK Chancellor Kwasi Kwarteng stepped in and dramatically changed the outlook.
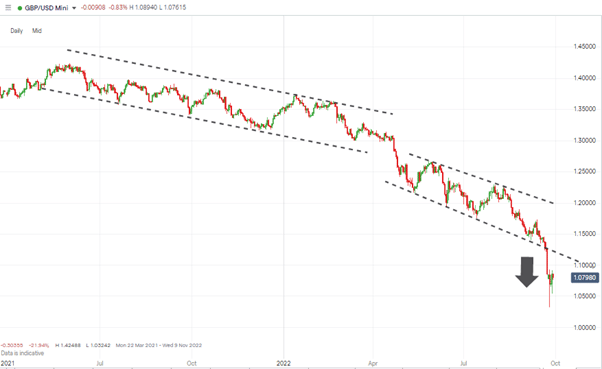
Whether you take the price channel dating from May 2021 to April 2022, or the steeper one from April to September 2022, the pound has made a paradigm shift. It is now trading outside of its long-term price channel. The question now is, what next for GBPUSD?
GBPUSD Price Chart – Daily Candles – 2021 – 2022 Price Channels
Source: IG
Kwarteng’s £45bn tax cut programme is due to be financed by government borrowing, and that has spooked the markets and caused a run on the pound. The high-risk nature of the government’s new policies has left many traditional lenders to the UK government unwilling to step in and buy gilts. That has resulted in billions of dollars of sterling positions being sold in exchange for other currencies perceived as a safer bet, especially the US dollar.
Also Read: GBPUSD Forecast and Live Chart
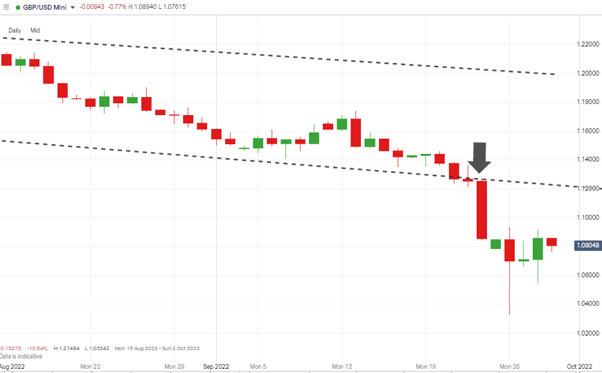
GBPUSD Price Chart – Daily Candles – 2021 – 2022 Price Channel Break
Source: IG
The “mini-budget” announced on Friday 23rd September hit the markets just as they were approaching a key support, the trendline dating back to April 2022. A price bounce in GBPUSD could have been expected, particularly as that would have fitted in with the previous trading history. As things turned out, not only did the GBPUSD rate break through the 1.124 price level, but the crash to as low as 1.032 took cable to price levels not seen since the 1980s.
The Technical Analysis and Trading Ideas Report of 26th September highlighted that the problem for GBPUSD traders is that as cable moves into uncharted territory, there are few historical reference points which could potentially trigger a bounce. Strategies which use momentum indicators to establish trade entry and exit points appear the best option for those who think the pound’s slide could continue.
For the bulls, or at least those who appreciate that all trends turn in the end, the obvious price target for any long position is the supporting trendline in the region of 1.12 which provided support between April and September and will now offer resistance.
People Also Read
- Trading Ideas as GBP Hits 37-Year Low
- Take Profits On GBPUSD Trades As BoE Prepares To Hike Interest Rates
- EURUSD Forecast and Live Chart
If you have been the victim of a scam, suspect fraudulent behaviour, or want to know more about this topic, please contact us at [email protected]


 Between 74-89% of CFD traders lose
  Your capital is at risk
  Your capital is at risk
  Your capital is at risk