The prospect of rising bond yields has certainly spooked the markets. The fixed income guys have the reputation of being some of the most brilliant guys in the room. Their decision on Wednesday to sell bonds and drive-up yields pointed to a long-term change in the economic outlook. That then created uncertainty in other asset groups and sparked a global sell-off.
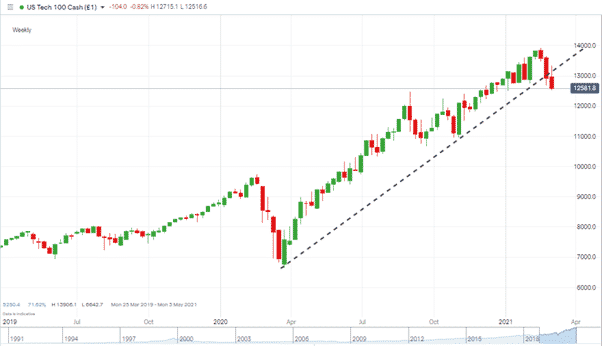
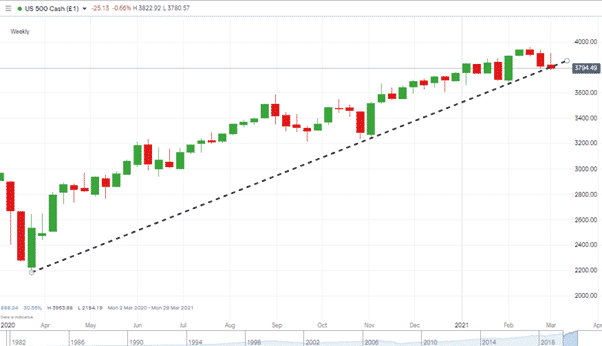
The shake-down was market-wide and has taken price levels to key long-term support levels. If risk-on assets bounce, this could be one of the buying opportunities of the year. If prices continue to slide and break to the downside, then investors will be looking to the playbook of last year’s March crash for guidance.
Global Equity Indices Fall in Value
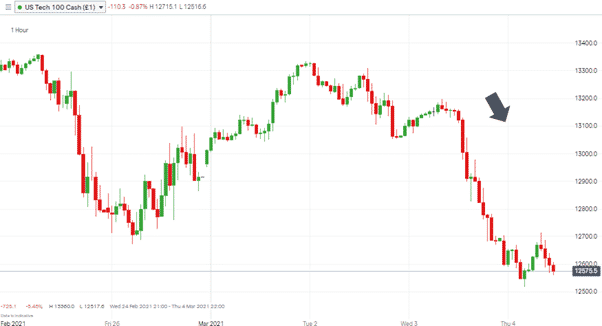
Into the US close on Wednesday, the Dow Jones Industrial Average slid 121 points 0.4%, the S&P 500 closed 1.3% down, and the Nasdaq Composite declined 2.7%. The hit to tech stocks representing investors in growth stocks taking a particularly dim view of the potential for a return of inflation.
Nasdaq 100 – 1H price chart
Source: IG
Asian markets followed the move, the Chinese CSI 300, again heavily linked to tech stocks, took the biggest nosedive and closed down 3% on the day, the lowest level for two months.
The open of European markets saw the DAX follow suit and lock in losses in line with Asian and American markets. Price then stabilising at the 1400 level. All eyes are now on Jerome Powell, Chair of the US Federal Reserve, who will address the markets later on Thursday. Many hope his trademark accommodative stance will calm their nerves.
Market Price Moves Driven by Strong US Fundamentals
Bond yield strength was based on stronger than expected manufacturing PMI data from Markit. Only two weeks ago, at the time of the mid-February report, the PMI number was 58.5. The month’s closing number was actually 58.6, a small move in numerical terms, but a significant one due to the shift happening in a short period.
With numbers well above the 50.0 contraction line and growing, all signs point to the US economy recovering.
Are Markets at a Tipping Point – Bulls and Bears Both Showing Interest
The slide in prices has left markets at crucial support levels. Buyers at these levels who then see prices rebound will be entering into trades at an optimal level. Sellers will be looking for a break-out to the downside and be equally optimistic about getting into that trade at the beginning.
The weekly charts of the major global equity indices pick out today as the day to put your money where your mouth is. Though it is something of a coin toss and following events using a Demo account might be a better alternative.
If this does mark the start of a new trend, whether upwards or downwards, then having virtual positions on as a marker could be a safer introduction to the situation. With momentum trading, there is something to be said for joining the party late once the move has been confirmed.
Nasdaq 100 – 1W price chart
Source: IG
US500 – 1W price chart
Source: IG


 Between 74-89% of CFD traders lose
  Your capital is at risk
  Your capital is at risk
  Your capital is at risk