- The Bank of England is set to raise interest rates – but by how much?
- Markets are split on whether the BoE will raise rates by 25 or 50 basis points.
- Bullish short-term price action would bring key long-term resistance levels into play.
Market analysts had already priced in a UK interest rate rise on Thursday but are now split 50-50 on what size the hike might be. An increase of at least 25 basis points is as good as guaranteed, but after Wednesday’s red-hot UK inflation report, half of the market considers a 50 basis point increase likely.
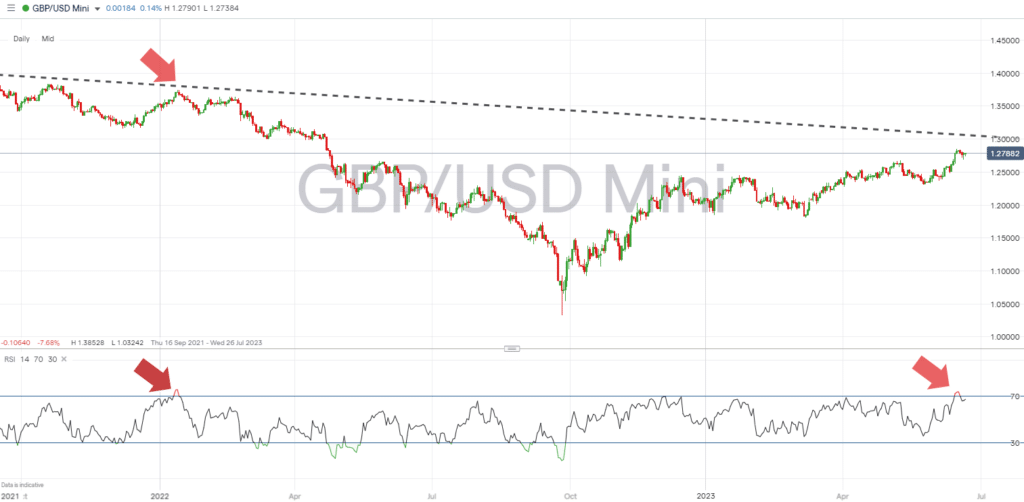
An uptick in short-term price volatility in GBPUSD can be assumed to follow. With traders split on the size of the rate rise, price will have to move to a level which is appropriate to whichever of the new interest rates applies soon after the BoE makes its announcement at midday. The recent bullish momentum can be expected to find additional support if the rate rise is 50 basis points. A rise of ‘only’ 25 basis points could trigger a short-term sell-off in a market already pointing toward being overbought. On the Daily Price Chart, the RSI currently sits at 66.7, but as recently as Friday 16th June was generating a reading of 73.2.
GBPUSD Daily Price Chart 2022 – 2023 – RSI > 70
Source: IG
To put the Daily Price Chart RSI number into context and highlight the significance of the indicator, traders only need to refer to last year’s price chart. The last time the Daily RSI was above 70 was in January 2022, when GBPUSD was trading at 1.37434. By September, the GBPUSD had fallen to below 1.04, and the pound had posted an almost 25% fall in value against the dollar.
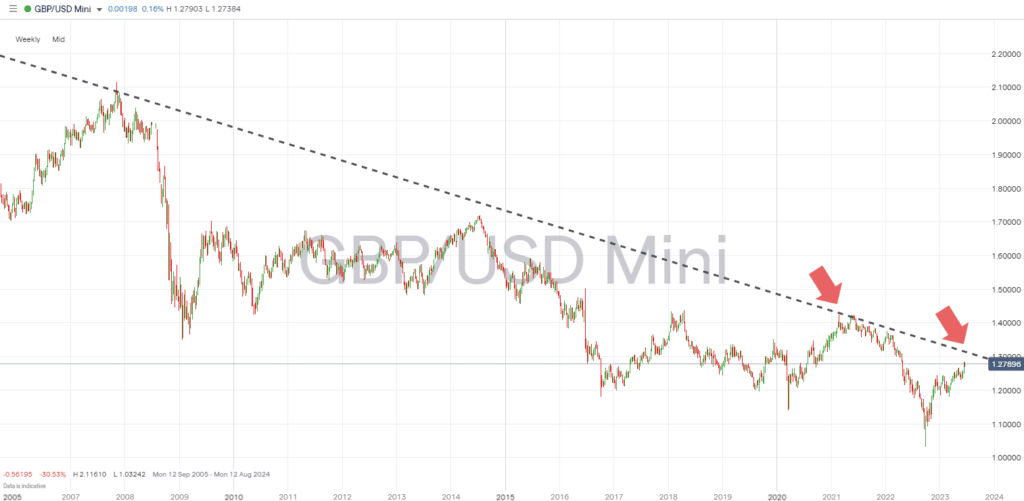
GBPUSD Weekly Price Chart 2023 – Resistance Trendline
Source: IG
Another resistance technical indicator is also coming into play – just as the pound’s rally since the lows of September 2022 could be running out of steam. The Weekly Price Chart shows an important multi-year downward trendline which currently sits in the region of 1.30. Previous attempts to break that resistance level occurred when as now, the RSI on the Weekly Price Chart was close to 70. All of them failed and were followed by a sell-off in GBPUSD.
The last test of the long-term trendline started in February 2021 when GBPUSD was trading above 1.40. At that time, the Weekly RSI peaked at 70.47. With the RSI on the Weekly Price Chart now at 65.56, a short-term burst of buying pressure on the back of a 50 basis point rate hike by the BoE could take GBPUSD into oversold territory and high enough to test the trendline. Two events which would trigger ‘sell’ signals from crucial indicators.
People also Read:
- “Hawkish Pause” Dominates EURUSD Strategy Planning
- The Week Ahead – 19th June 2023
- WEEKLY FOREX TRADING TIPS – 2023.06.19
If you have been the victim of a scam, suspect fraudulent behaviour, or want to know more about this topic, please contact us at [email protected]


 Between 74-89% of CFD traders lose
  Your capital is at risk
  Your capital is at risk
  Your capital is at risk