The French philosopher Voltaire once wrote, “Uncertainty is an uncomfortable position. But certainty is an absurd one.” We are one month into the Trump Presidency, and, if anything is certain, it is that a great deal of uncertainty persists. Financial markets are in a quandary as to next steps, tense, if you will. Voltaire understood that you can never know everything about anything, but, if you remain vigilant and continue to ask questions, the level of discomfort gradually dissipates, and you accept the situation.
There are benefits to uncertainty. It does keep us on our toes. We may never be able to predict indisputable outcomes, but the process is one that leads to discovery. In that vein, analysts are busy at work, poring through history books and searching for any correlations that will, hopefully, lead to fame and fortune. From the host of articles on today’s uncertain times, one can quickly discern that equity markets are straining to go higher without concrete actions from the Trump administration. Inevitably, the course of the discussion heads negative. Are we at a top? Is a major drawdown a real possibility?
Read more forex market news
What are probability models telling us about the year ahead?

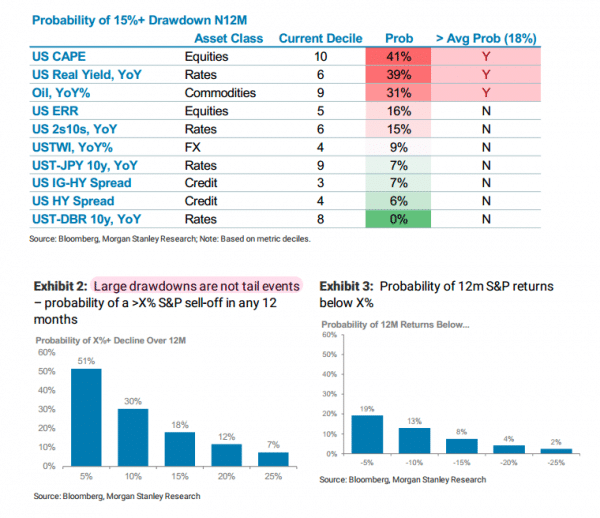
How likely are we to see a major sell off in the next twelve months? Stocks have been on the rise for the past two weeks after Trump met privately with leading CEOs in America. Their tone after hearing Trump’s comments was upbeat and positive about the possibility of tax cuts and the turning back of needless regulations. The market has responded positively, as well, but now already stretched metrics have been forced to a higher level. Tax and regulatory reform will take time and money from Congress. Central banking policy has nowhere to go but to new austerity venues. Political tensions across the globe, primarily in Europe, are rising. Volatility remains low, but the second any of these dominos falls, every automated trading robot on the planet will issue a Sell order.
No one is getting off the Trump Train just yet. There may always be a “Greater Fool” around the corner to take out your position, but major sell offs have a way of fooling everyone at the same moment in time. As the author of the above chart attests, “Large drawdowns are not tail events.” Once you review the data presented above and accept the average probability of 18% conveyed by the modeling, you must conclude that the occurrence of a major sell off does not necessarily require a “Black Swan” to appear. It is not a “Fat Tail Anomaly” that is two to three standard deviations outside the mean.
The two phrases cited in the previous paragraph were the excuses that most analysts put forward to describe the onset of the Great Recession. In their own words, it was impossible to forecast such rare events, although there were a few astute souls that shorted the market and made billions. Perhaps, that last factoid is the reason why so many are so hard at work searching for this situation’s “Holy Grail” – the one chart that spells doom for this economy and a reliable timetable to leverage for gain and profit.
The modeled probabilities under Equities, Rates, and Commodities average out at 37%, a cause for alarm in most any analyst’s playbook. If you focus on a single index, like the S&P 500 for example, history may paint for you a more palatable set of statistics. The two lower charts in the diagram display actual historical probability demographics for both declines and negative returns for selected twelve-month periods in the past. The probability of a 15% pullback, the definition of a major correction, is nearly one chance in five, or 18%. Negative returns beyond 20% appear to be in the “fat tail” territory.
When there is uncertainty, look for confirmation from other sources.
Assessing probabilities is one way to put protective boundaries around your predictions for the future, but no one can take various chance scenarios or Monte Carlo simulations to the bank. Checking in with various banking investment departments is another way to see a clearer road ahead, accepting that, even if bankers have an inside track, they rarely publish how they did in the past. Charts that depict never-before-seen correlations are also an alternative that seems to gain more favor among analysts far and wide.
What are banking gurus postulating these days? Believe it or not, one analyst was highly amused that both Deutsche Bank and Goldman Sachs seemed to be ascribing to the “Greater Fool” theory. Per DB, “Historical evidence teaches us that when the market gets overheated and shoots past its fair value spread on its way to cyclical tights.” And Goldman chimed in, “We are more cautious as we do not forecast large overall returns in equity from here, but continue to see equities as the best place to benefit from the strong growth backdrop.”
What was this pundit’s take on these words of wisdom from the “Big Guys”: “What that says is basically that when the market overshoots, it tends to overshoot more, and therefore ‘overheated’ becomes a buy signal. When the market is stretched, it tends to get more stretched, so maybe you should get more long. That’s the most backwards logic I have ever heard.” Just remember that bankers need to shift their portfolios around, as well, and the only way to do that is to convince others to buy their castoffs.
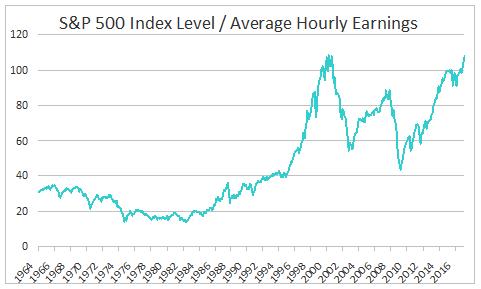
One interesting chart that came across my desk this week had to do with comparing the S&P 500 index to Average Hourly Earnings, way back from the sixties until present times. It was another twist on the logic that, as disposable income increases over time, then the need to invest in equities is a logical place to deposit extra funds. Instead of tracking these two data flows on opposing vertical axes, this analyst chose to divide the two items to form an index-like presentation. The expectation is that the index would bounce between well-defined boundaries, a sign that stock valuations are appropriate.
So much for expectations over the past two decades! What transpired after the nineties? For one thing, average wages went flat over the period, the result of decades of outsourcing/offshoring and technology that destroyed jobs faster than it created them. The peaks from the Internet Bubble and the Great Recession are apparent, but will a third time be the charm, as the chart predicts? If stocks are too expensive for American workers, does that mean that they are overvalued?
Are there logical explanations for the immediate divergence after the millennium crossover? Supporting arguments point to income inequality. Wealthy investors tend to buy more stocks than do the working man’s 401k account. Our near-zero interest rate environment has skewed valuations over the period, and high-valuation components of the S&P 500, primarily tech companies these days, are typically less labor intensive and have thrived more in our modern day digital economy. In any event, valuations are stretched, and this presentation is just one more warning sign of what may come.
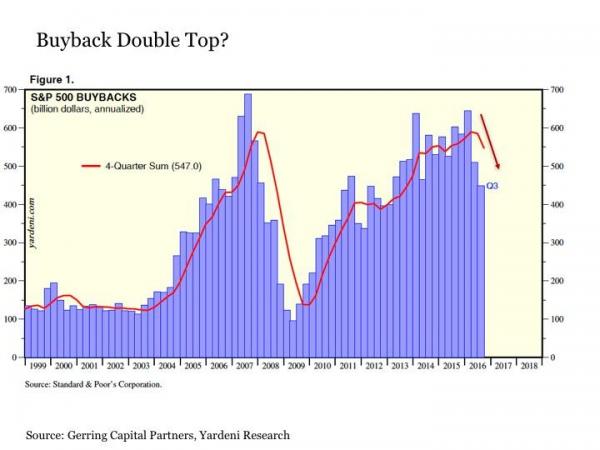
What about corporate insiders? What have these S&P 500 leaders been doing with all that cheap money and extra cash? As we wrote in our previous piece, the target for excess liquidity in the corporate realm has not been economic risk taking, i.e., investing in “capital expenditures, a form of economic risk taking that creates jobs in the process.” Unfortunately, excess funds found their home in stock buyback programs and domestic acquisitions. As history has shown, major corporations buy back their shares when they know they are undervalued, thereby producing higher returns for both themselves and their approving shareholders. Where are we on that slippery slope?
Oops! Another downtrend in the making, if the current rolling-4-quarter trend holds true to its leading indicator nature prior to the Great Recession. We may truly be in uncertain times, but is pumping more air into an already over-inflated balloon a wise thing to do at this juncture? Trump and his merry band of advisors seem determined to do just that.
A few words on decision making in times of uncertainty
If you are expecting the veil of uncertainty to dissipate anytime soon, then you might take this one opinion to heart: “Trump is high volatility. Not only is Trump shockingly unpredictable, he’s apparently deliberately so; he says it’s part of his plan.” If this is the foreseeable roadmap, then, perhaps, a few cogent words on how to make decisions during uncertain times are appropriate.
How does one make smarter choices amid constant political and economic uncertainty? The experts in this arena suggest that a process be followed in a step-wise manner:
1) Research beforehand: The idea here is not to be surprised by surprises;
2) Document your reasoning: Write your reasons down to prevent hindsight bias later on that could worsen a situation;
3) Remain humble: Mistakes will happen, and do not fight Mr. Market;
4) Avoid the blame game: No one gets it right all the time, but own your decisions, no excuses allowed;
5) Assess probabilities: Walk through your preferred scenario by assuming that basic assumptions vary widely. Simulations help you prepare for surprises;
6) Keep the faith: Believe in your process. It is easy to overlook ordinary things, but your process gives you helpful guideposts during stressful times.
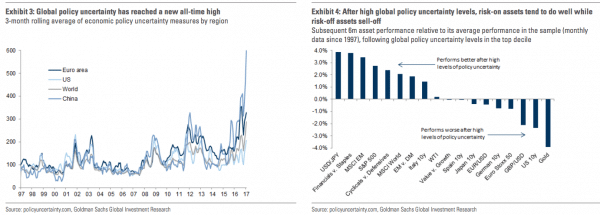
The Press has focused on Trump as the major source of uncertainty on the political front, but Goldman Sachs actually believes that the U.S. is trailing other markets in their modeling of political uncertainty:
China and Europe are higher on their scale of measures. Where might you go when the sell off turns fast and furious? The chart on the right may seem counter-intuitive. During the run up, risk-off assets may do well, but afterwards, risk-on assets take over, once uncertainty declines. Do we live in different times? Be careful with that notion.
Concluding Remarks
Per one Internet source, “The ‘Greater Fool Theory’ is the theory that states it is possible to make money by buying securities, whether overvalued or not, and later selling them at a profit because there will always be someone (a bigger or greater fool) who is willing to pay the higher price.” The sad truth about human nature is that investors that laugh at this amusing theory about the “greater fool” typically deny that they are acting like one.
Are you in denial? Are you a Greater Fool? When the “Big Crunch” comes, there will be ample volatility and opportunity to profit wisely in the forex market. To be forewarned is to be forearmed!


 Between 74-89% of CFD traders lose
  Your capital is at risk
  Your capital is at risk
  Your capital is at risk