The first trading week of January saw some blockbuster moves in several asset groups. Those who got involved in the price action will likely have seen significant moves in their trading P&L. There are signs that prices are levelling off though and as the market catches its breath some interesting questions are surfacing.
Bitcoin & Gold
Bitcoin was up more than 9% and Gold down more than 3%. This divergence adds intrigue to the hypothesis put forward by JPMorgan, which weighed up the crypto’s chances of being ‘the new gold’. It’s hard to reconcile two assets being closely correlated when their prices break away by 10% in the space of one week.
Silver
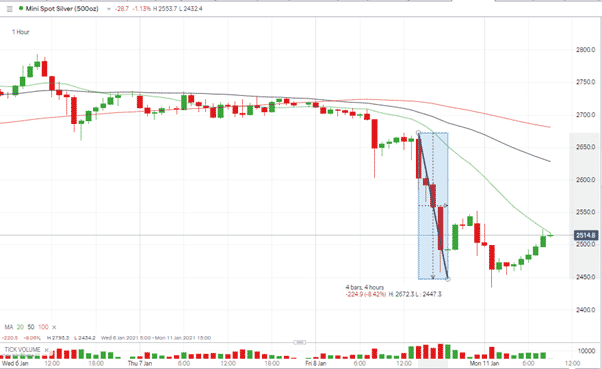
Silver recorded a price crash of 7.35% over five trading sessions. Many of the losses were posted on Friday after the release of the US Non-Farm Payrolls jobs report. In the space of several hours, the price of silver slid by more than 8%, from $26.50 to $24.50.
Silver – Daily chart
Source: IG
This would have posted a return for anyone who had a short position but was also an indicator of a US Dollar based macro-trend which might come into play in the market. The next trading sessions will be crucial for silver which is facing tough technical resistance to any rebound.
Trading during Monday’s Asian session was associated with signs of a low-commitment relief rally forming. Soon after the European markets opened the price was buffering but not breaching the 1H 20 SMA.
Silver – Weekly chart
Source: IG
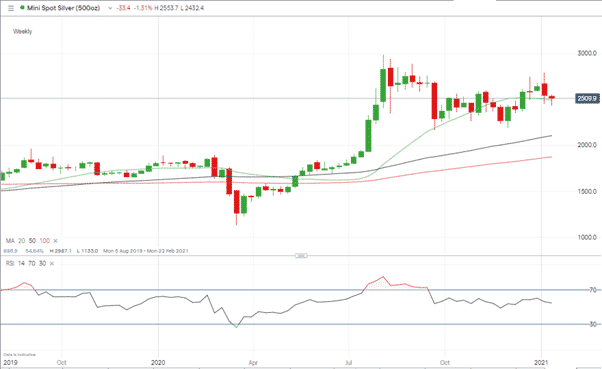
Price is supported by the Weekly 20 SMA but if it breaks that 24.92 level then the next significant support levels are the Daily 50 SMA at 24.87 and the 100 SMA at 24.65. The RSI’s lack of conviction confirms how hard it is to have confidence in any take on the metal’s current situation.
USD
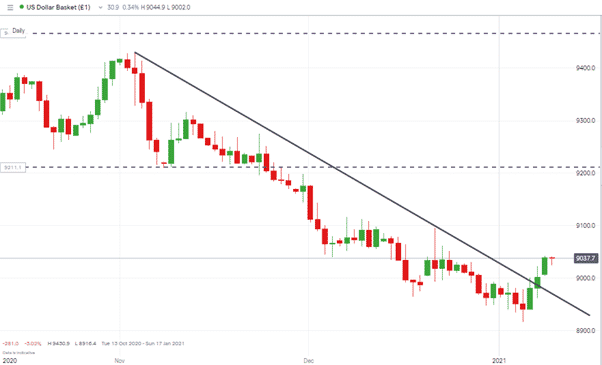
As is often the case, the pivot for the moves in Bitcoin, Gold and Silver markets was the US Dollar. It’s hard to reconcile the direction of travel of the three instruments, but developments in the greenback at the tail end of last week will have repercussions for these and all other markets.
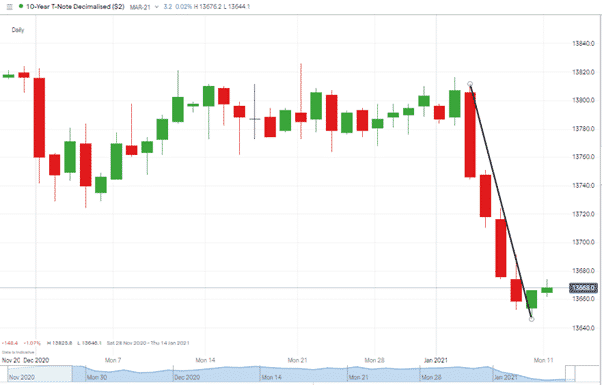
Friday’s disappointing job numbers saw the benchmark US government bond, the 10-year Treasury, fall in price. As this effectively increases the return to investors, buying T-bills is a more attractive proposition. That will cause cash to drain out of precious metals and into US bonds.
US 10 Yr Treasury – Daily chart
Source: IG
Monetary and fiscal stimulus measures could be on their way to support the US economy. This all looks like moves from the 2008 playbook where quantitative easing saw all asset markets rally. The cash has to find a home somewhere.
USD Basket – Daily chart
Source: IG
Holders of precious metals have been reminded that they offer no yield at all and are at risk of being devalued through price inflation. That suggests that gold and silver prices could be interesting viewing over the next few days.
If you want to know more about this topic, please contact us at [email protected]


 Between 74-89% of CFD traders lose
  Your capital is at risk
  Your capital is at risk
  Your capital is at risk