The majority of last week’s price moves were in line with a sleepy end to the first quarter. Equity investors saw the major indices close up on the week, FTSE 100 +0.70% and S&P 500 +1.18%. The US dollar found some strength, and EURUSD was down -0.85% and GBPUSD down -0.62%.
Getting into positions before Q1-end
The slight disconnect between equities (risk-on) and USD (risk-off) was potentially explained by institutional investors’ actions. With the end of the first quarter approaching, many sizeable funds would have been positioning themselves in the sectors which make the best reading in the quarterly reports. Hitting the bid on stocks and driving prices up can be a side-effect of that.
Ever Given / Suez blockage sends oil prices lower.
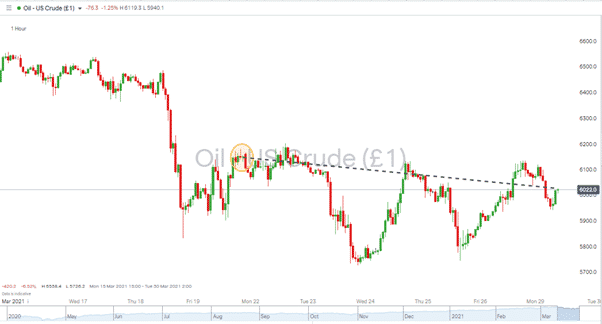
Potentially more surprising was the move in oil prices. With the Suez Canal out of action for an unknown period, the oil supply has been significantly disrupted. Tanker rates, the cost of securing space on a vessel doubled in a few days, but the price of crude itself dropped away.
Source: IG
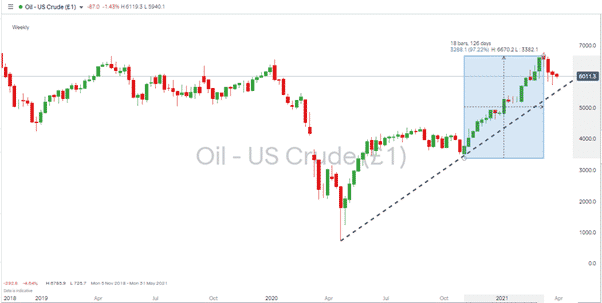
Seasonal changes in demand for oil and liquified natural gas have been suggested as reasons that prices haven’t spiked. It is, however, a surprise that a shock factor that would typically be associated with a price drop has had the opposite effect. In the 18 weeks from the 2nd of November, the price of US crude shot up by >97%. That bull run seeing only three weeks experience of price falls.
Will a rising tide float the ship?
Experts analysing the situation had tipped Sunday’s extra-large high tide as an opportunity to try and free the Ever Given. Early reports on Monday suggest some progress has been made and that the vessel’s position has been corrected by some 80%. The ship’s stern, which was previously four metres from the bank, is now clear by 102 metres. Monday will see additional measures being taken to get the vessel underway.
When the blockage is cleared, regular service in the Canal is expected to resume within a matter of hours. Given the recent slump in prices, the news could lead to further downward price movement.
Source: IG
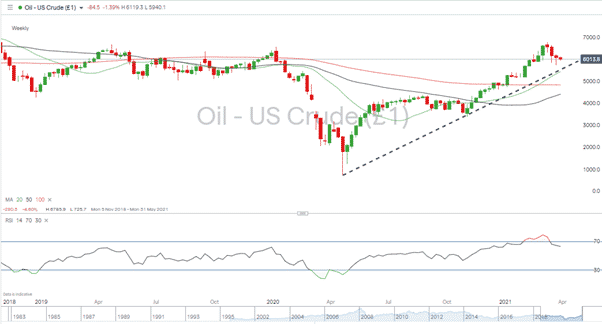
The supporting trend line of the month-long bull run currently sits in the area of $55.50 per barrel. A test of that level can’t be ruled out, particularly as the weekly RSI is still hovering below 70.
The weekly 20 SMA also sits in the region of $55 at $54.36, and a real test of oil prices could see the 100 weekly SMA, currently at $48.34, come into play.
Source: IG
The next seasonal shift in demand is the US’ Driving Season’, which could be a significant factor this year with so many people taking advantage of the relaxation of lockdown measures. Memorial Day is widely considered to be the event that kicks off driving season. Being on the 31st of May, it is still some way off.
The OPEC ministers meeting is pencilled in for this week (31st March – 1st April); that might also provide a catalyst for price moves. The consensus seen over the last nine months has surprised many and looks unlikely to be improved upon.
If you want to know more about this topic, please contact us at [email protected]


 Between 74-89% of CFD traders lose
  Your capital is at risk
  Your capital is at risk
  Your capital is at risk