The beauty of the financial markets is that they provide something for everyone. This week looks distinctly like a happy hunting ground for range traders with prices holding steady across the board.
Lower Volumes, Lower Price Volatility
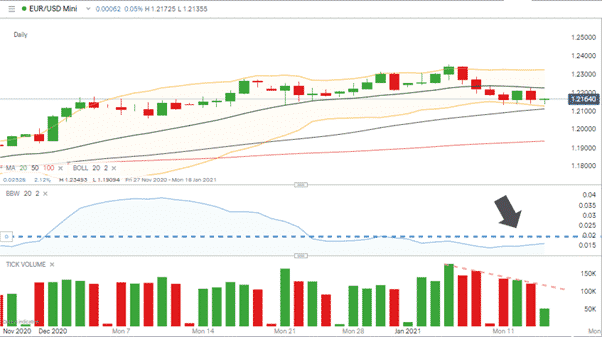
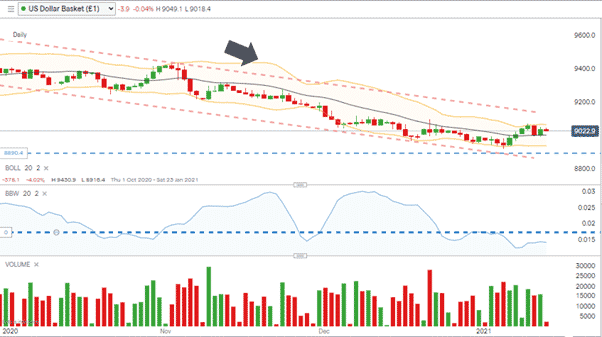
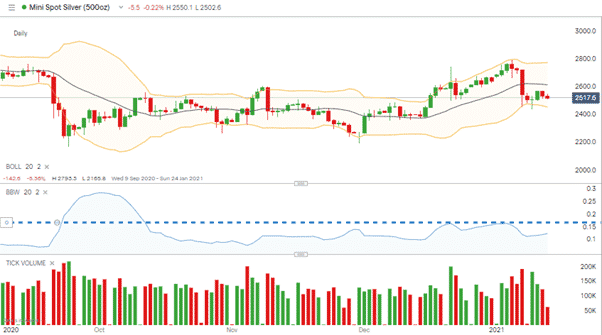
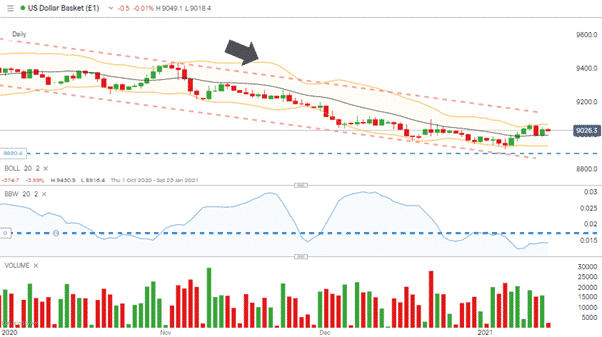
The FT analyst’s research note highlighted falling trade volumes as a factor to watch. That particular trend has continued with Bollinger Bandwidth charts across different markets printing long-term lows. In the EURUSD, the USD Basket and Silver markets Bollinger bandwidth and volumes have dropped off.
EURUSD Daily Chart – Trading Volumes & Bollinger Bandwidth
Source: IG
USD Basket Index Daily Chart – Trading Volumes & Bollinger Bandwidth
Source: IG
Silver Daily Chart – Trading Volumes & Bollinger Bandwidth
Source: IG
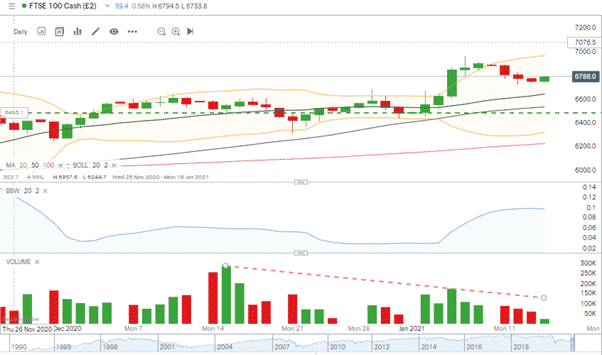
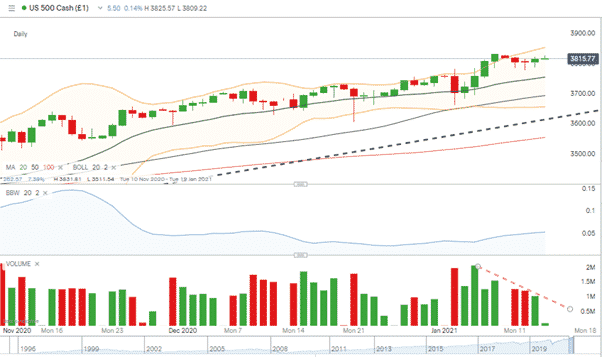
The equity markets have also seen volumes slide but record a momentary spike in volatility based on last week’s mini-rally. Still, even in those markets, the bandwidth has plateaued.
Zooming in on the FTSE 100 market, there has been only one day in January where trading volumes were greater than they were on the 21st of December.
FTSE 100 Daily Chart – Trading Volumes & Bollinger Bandwidth
Source: IG
US 500 Equity Index Daily Chart – Trading Volumes & Bollinger Bandwidth
Source: IG
As anyone who has traded for some time will tell you, the end of this particular story is that markets always eventually break out to one side or the other.
Momentum traders might at this moment be busily resisting boredom trades. There’s not much going on for them, and forcing a trend-based strategy into a sideways moving market can be costly. There would be nothing wrong with focussing instead on research, but if they were keeping an eye on the markets, then the USD Basket would be a good one to follow.
Looking to USD Basket Index for Signs of the Next Move
At first glance, the USD Basket chart might not look particularly exciting, but it is one that many analysts will be watching. A quick scan of the IG news flow for the market shows that the broker is issuing reports on the subject every few hours.
“FOREX-Dollar holds gains as expectations for Biden’s stimulus grow”
“China’s yuan eases as dollar rebounds on higher US yields”
“FOREX-Dollar extends rebound as investors await US stimulus details, bitcoin bounces”
Source: IG
USD Basket Index Daily Chart – Trading Volumes & Bollinger Bandwidth
Source: IG
Devoting attention to research rather than boredom trades could offer trend-strategy traders an insight into the direction of the next move.
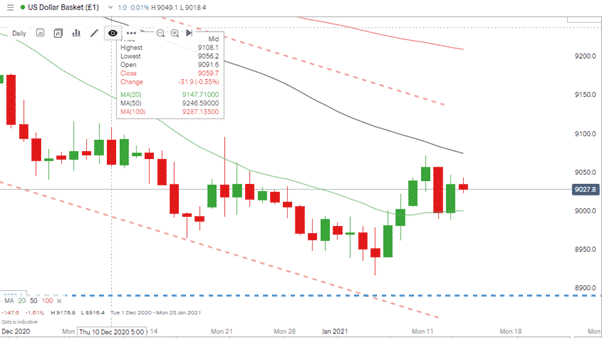
The slow and steady move to the upper end of the long-term downward trend channel is an important development for USD Basket. On Monday, the index even momentarily broke the upper Bollinger band. A pullback followed the yearly high of 9071.20, but that in turn was supported by the 20 Daily SMA.
USD Basket Index Daily Chart – Simple Moving Averages
Source: IG
The question now being asked is if that was a dip-buying opportunity with the 50 Daily SMA some way above current price levels at 9074.22?
If you would like to know more about this topic, please contact us at [email protected]
 Between 74-89% of CFD traders lose
  Your capital is at risk
  Your capital is at risk
  Your capital is at risk