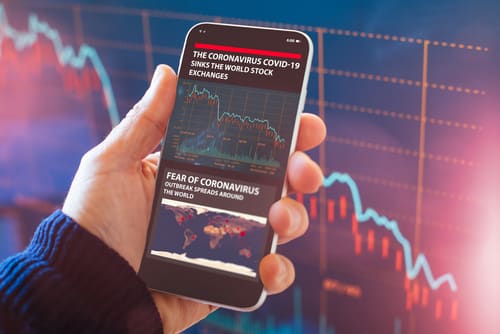
Tuesday marks the anniversary of the start of the first lockdown in the UK, and it’s clear that the events of the last 365 days have favoured some markets more than others.
The predominant theme was a rotation into assets after the correction in prices in March 2020. That being seen as better suited to the new way of doing things. Business and leisure practise having been dramatically and permanently changed, presenting new opportunities and exposing old weaknesses.
Stock Indices – The Shortest Bull Market in History
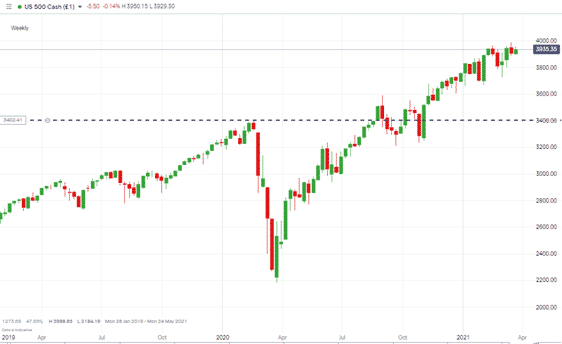
The March 2020 two-week market crash of more than 30% in some stock indices was followed by a recovery so rapid that 2020 marked the shortest lived bear market in history. The rapid rise in the S&P 500 after the low on March the 22nd being explained by investors moving from fear to greed at a pace not seen before.
The US benchmark index was by the 24th of August back to posting all-times highs.
S&P 500 – Weekly Candles
Source: IG
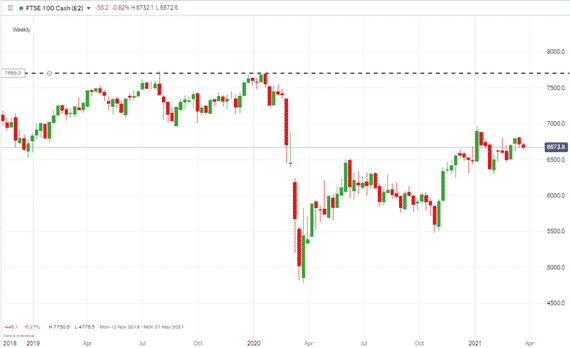
Not all markets responded to the same extent. The FTSE 100’s rebound has been held back by its constituents being comprised mainly of out of favour stocks. Consequently, the index has failed to return to pre-Covid price levels.
FTSE 100 – Weekly Candles
Source: IG
Asian markets and European stock futures were treading water on Tuesday morning. The US markets posted small up-days on Monday and price looks to be consolidating following those small gains.
Oil Prices Slide to a Halt
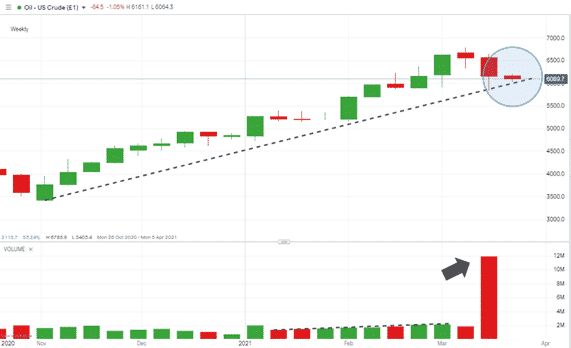
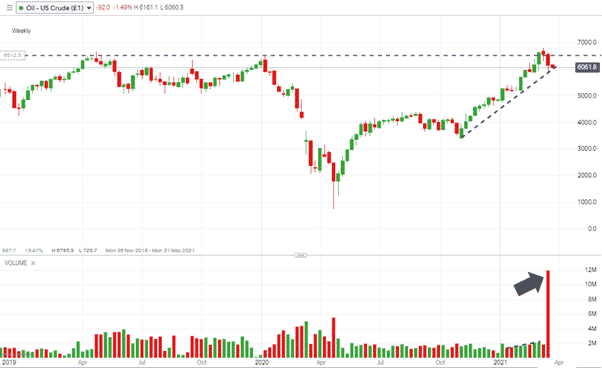
Crude oil prices have been a good measure of market volatility lately. After a multi-month surge, that market has seen a sell-off and more than 8% of value was lost last week. So far this week, it’s been trading in a tight range on its trend-line support.
Oil – Weekly Candles
Source: IG
The weekly price chart shows an interesting recent spike in trading volumes coinciding with the sell-off. As yet, there is no break to the downside. The below chart over a longer time frame puts the volume spike into a different light.
The lack of enthusiasm to take prices higher being partly down to the commodity finding resistance at the $65.46 price level, which marked the 2020 high (January the 6th, 2020).
Oil – Weekly Candles 2019 – 2021
Source: IG
Gold & Silver
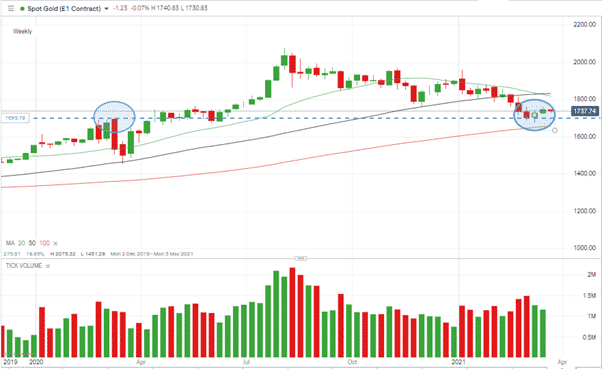
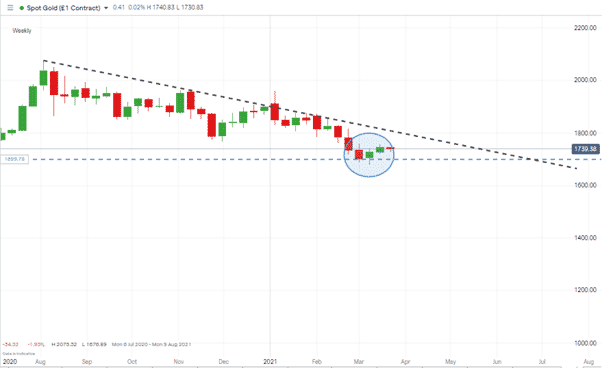
The March 2020 sell-off saw even safe-haven assets fall in price as investors scrambled for liquidity. Gold prices rebounded from the March low; however, following the August 2020 peak of 20.75, they have since fallen back to the key support level of $17.03. That price marks the pre-Covid high. The descending wedge pattern now forming offers an opportunity for traders to line up a long-term trade depending on the direction of the next break-out.
Gold – Weekly Candles
Source: IG
Gold – Weekly Candles – Descending Wedge
Source: IG
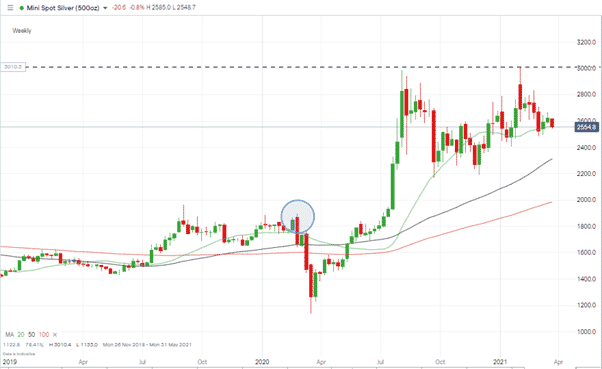
Silver prices have held up better than those of gold, thanks mainly to the metal’s role in industrial production and the hopes of economic recovery. The price action remains bullish on a weekly basis and the Weekly 20 SMA continues to provide support. The two failed tests of the $30 resistance level could be a taster of what is to come.
Silver – Weekly Candles
Source: IG
If you want to know more about this topic, please contact us at [email protected]
 Between 74-89% of CFD traders lose
  Your capital is at risk
  Your capital is at risk
  Your capital is at risk