With a range of data reports about to be released, the focus looks set to shift from China to Western markets.
Asia
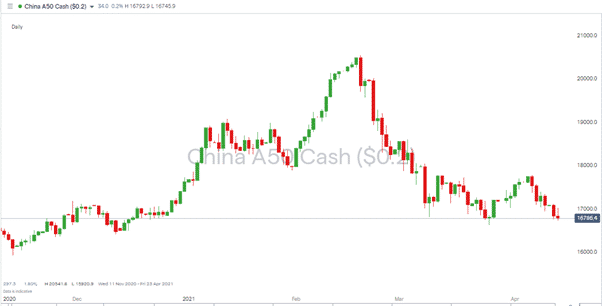
After a shaky start to the week, Asian markets found some strength overnight. Indices in Japan, Hong Kong and Australia all posted positive daily returns. The mood was tempered by the unwillingness of the China CSI 50 to join the party, that index being held back by reports showing a deterioration in the China trade balance during March.
- China exports up 30.6% year-on-year and undershooting the 35.5% increase analysts had forecast.
- At the same time, China imports increased by 38.1% compared to March 2020, which was higher than the 23.3% increase analysts had forecast.
- March trade balance for China for March was $13.8bn compared to analyst forecasts of $52.05bn.
Source: IG
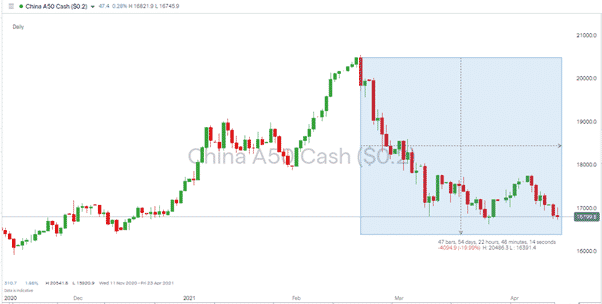
Key Indicators: A break of the 25th of March low at 16619.9 would open the door to the key price level at 16391.4. Breaking that lower price level would represent a 20% decline in value from the 18th of February high and mark the CSI 50 moving into a technical Bear Market.
Source: IG
Europe
UK exports to the EU rebounded in February. Brexit red-tape and stock-piling in Q4 had been blamed for a steep drop in January.
- UK exports to EU – down 42% in January and up 46.6% in February.
The FTSE 100 opened the Tuesday session in negative territory. The yo-yoing trade numbers highlighting the uncertainty that still hangs over the Brexit situation.
Source: IG
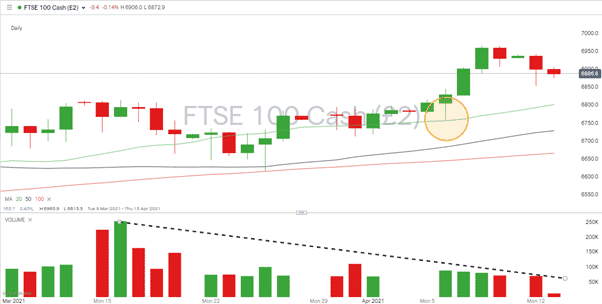
Key Indicators: Last week’s price surge came from a bounce off the Daily 20 SMA on Tuesday the 12th of April. That metric currently pricing at 6801 sits next to a big number support level at 6800, making support levels in that area key to any further upward moves.
Also notable is the drop off in trading volumes over the last month. It may be too early to “sell in May and go away,” but seasonality and the likelihood of recovery being already priced in appears to be weakening the bulls’ momentum.
US
Looking forward, all eyes are turning to the start of Earnings Season in the US. Bellwethers of the economy lead the way on Wednesday when Goldman Sachs, Wells Fargo and JPMorgan all release their Q1 earnings data.
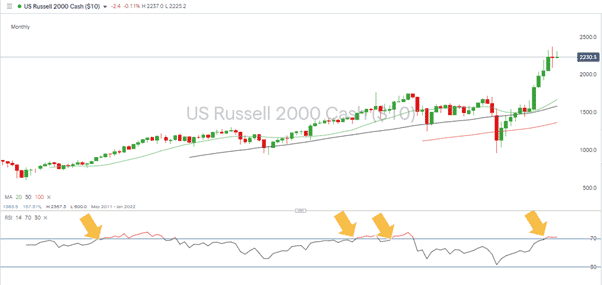
The Russell 2000 index, which reflects the health of the US domestic economy, has had a stellar run. Up by more than 130% from the March 2020 lows, the index looks overextended on a monthly basis.
Key Indicators: The March doji candle has a high of 2367 and a low of 2084. There have been few news events during the first half of April. The standout announcement being the barnstorming Non-Farm Payroll jobs numbers. While that offered some support to prices, April has seen the Russell trading comfortably inside the March extremes. A break out of either end of the 2084 – 2367 range would likely be followed by many, and the earnings reports due to be released could be what moves price to one of these extremes.
Monthly RSI continues to print above 70.
Source: IG
If you want to know more about this topic, please contact us at [email protected]


 Between 74-89% of CFD traders lose
  Your capital is at risk
  Your capital is at risk
  Your capital is at risk