Half-way through the trading week and the mood of calm in the markets has seen all the main asset groups gain ground. Commentators point to the increased likelihood of further government stimulus but whatever the catalyst has been, the price moves are available to see in black and white.
| Instrument | Monday | Thursday | % Change |
| GBP/USD | 1.3834 | 1.3733 | 0.74% |
| EUR/USD | 1.2126 | 1.2045 | 0.67% |
| FTSE 100 | 6,525 | 6,503 | 0.34% |
| S&P 500 | 3,912 | 3,898 | 0.36% |
| Gold | 1,842 | 1,811 | 1.71% |
| Silver | 2,714 | 2,701 | 0.48% |
| Crude Oil WTI | 58.22 | 57.39 | 1.45% |
| Bitcoin | 44,763 | 39,276 | 13.97% |
| UTC:09.12 | UTC: 08.42 |
Equities
The nearly identical percentage gains made by the S&P 500 (+0.36%) and FTSE 100 (+0.34%) are eye-catching. The two indices might both be made up of equities but that is where the similarities end.
- The S&P 500 gained 16.26% in 2020, thanks to its members including sub-sectors favoured by investors, such as tech-stocks.
- Over the same period the FTSE 100 fell by 14.3%, the index held back by its weighting towards oil and banking.
The lack of differential in performance suggests big institutions are drip-feeding their cash into the stock markets. The lack of conviction means traders will need to be wary of the lack of momentum leading to profit-taking on Friday.
Gold & Silver
At the same time that global equity markets have enjoyed widespread support, gold and silver prices have actually outstripped the gains on the benchmark stock indices.
The precious metals are often seen as a hedge against risk and the two markets aren’t supposed to run in parallel like this, at least not in the long term. The questions raised are how to explain this and which trend is going to give?
Gold
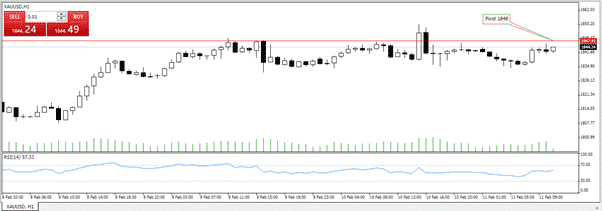
Gold has bucked the predictions outlined in Monday’s daily technical matrix, which had it as a “Strong Sell” on a daily basis. Instead, it has risen in value by 1.71%. The break out to the upside required it to pierce through a range of indicators
- Following its low of 1792 on Friday the metal has had four consecutive up-days.
- The size of the move in gold is itself notable.
- Trading volumes on Monday were at the highest level since the 4th of November 2020 providing a confirmatory indicator for the move.
Source: Tickmill
The pivot for gold currently sits at 1848 and the hourly chart shows price movement towards that level being rebuffed. If the risk-off asset is the one to fall away, downside target prices are:
T1: 1828
T2: 1818
It will be hard to differentiate a sell-off from a short-term pull-back. Any break of 1848 and upward target prices are:
T1: 1855
T2: 1862
GBPUSD
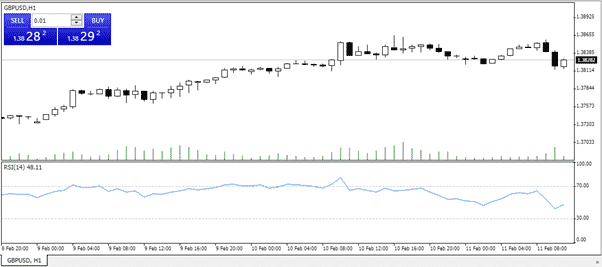
The Forex Traders analysts on Monday tipped GBPUSD as being likely to rally. Their reports don’t always come good, but this looks like a good call.
Now trading above 1.38 the pivot for cable is 1.382. Already up 74 basis points on the week, there appears to be less resistance to the upside. Target prices to the upside are:
T1: 1.3865
T2: 1.3885
Source: Tickmill
If you want to know more about this topic, please contact us at [email protected]


 Between 74-89% of CFD traders lose
  Your capital is at risk
  Your capital is at risk
  Your capital is at risk