When trading forex, whether you are a novice or an experienced trader, it is crucial that you know how to manage risk. One of the best ways to do this is by monitoring volatility. Assessing forex risk using volatility plays an integral part in proper risk management.
In this article, we will explore what volatility is and look at the various ways that forex risk can be measured so that you have a better understanding of how to assess your trading risk.
Assessing Risk Using Volatility
When it comes to assessing risk in the forex market, volatility is one of the key indicators that traders look at. Volatility measures the amount of price movement that a currency pair experiences over a certain period of time, and it can give traders an idea of how risky a particular currency pair is.
Generally, the more volatile a currency pair is, the riskier it is to trade. This is because big swings in price can lead to losses just as easily as profits.
As a rule of thumb, when a currency pair is highly volatile, traders will often consider reducing their position sizes to limit their exposure to risk.
During less volatile market conditions, a currency’s price fluctuations tend to be more stable, which traders might see as a less risky trading environment and therefore revert back to the position sizes they would normally trade with.
Related Articles
- Forex Volatility – What is it and How to Trade it?
- Interest Rates and Volatility
- What is the VIX Index?
How to Measure Volatility
Statistically, there are two main ways to measure volatility. The first is historical volatility and the second is implied volatility. We will discuss these two methods in more detail later in this article, but there are also some well-known indicators that can be used to assess forex risk at any given point in time, which we will take a look at next.
Image for illustration purposes only
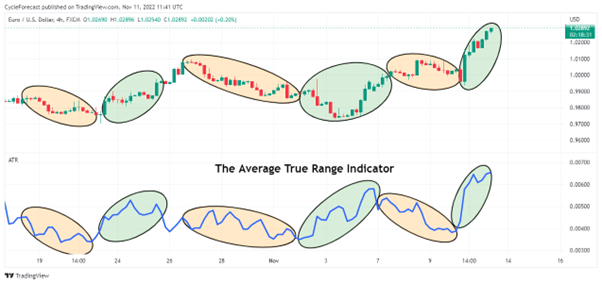
The first technical indicator that can be used to assess forex risk is the average true range (ATR) indicator.
The ATR indicator was created to measure market volatility by calculating an average value of the current true range compared to previous ranges.
The image above shows the ATR indicator (blue line) on the lower panel of the chart. The green ovals were added to show the periods where the ATR of this currency pair increased, while the light orange ovals were used to mark the periods where the ATR decreased.
Notice how the ATR declined during periods where this currency pair corrected lower or moved sideways, which indicated that the candlestick ranges were getting smaller compared to previous periods, leading to less volatile conditions at the time.
Conversely, the ATR increased when this currency pair trended higher with larger candlesticks, showing an increase in volatility.
Simply put, a higher ATR reading indicates that a currency pair is experiencing higher levels of volatility, whereas a lower ATR reading indicates lower levels of volatility.
Image for illustration purposes only
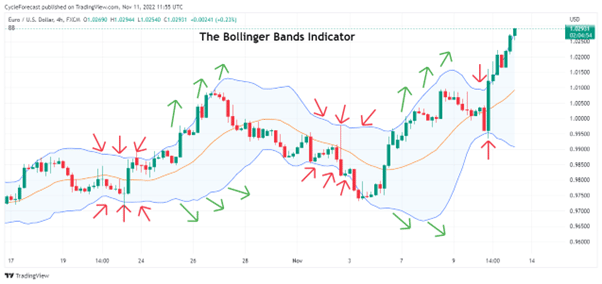
The second indicator that can be used to assess forex risk is the Bollinger bands indicator.
Technically, the Bollinger bands indicator falls under the momentum indicator category, but it can be useful to assess forex volatility.
Bollinger bands expand during periods of higher volatility and contract during periods of lower volatility. Price also tends to revert to the simple moving average (centre orange line) or the opposite side of the Bollinger bands, after either side of the Bollinger bands is reached or breached.
On the chart image above, notice how the upper and lower Bollinger bands contracted during consolidation phases (red arrows) and expanded during trending phases (green arrows).
Traders will often expect an increase in volatility after a period where the Bollinger bands narrowed and expect volatility to decrease again after a period where the Bollinger bands expanded.
Knowing how the Bollinger bands tend to behave during elevated and reduced volatility periods can be useful in assessing forex risk and allow traders to adjust their position sizes accordingly.
Using Implied Volatility to Measure Future Risk
When it comes to measuring future risk in forex trading, volatility is key. By looking at the implied volatility (IV) of a currency, traders can get a sense of how volatile market participants expect that currency to be in the future.
Implied volatility is therefore useful in reading traders’ current market sentiment about what could possibly happen in the future. The higher the implied volatility reading is, the greater the expected forex risk is for a currency, and vice versa.
One useful way to assess forex risk is by looking at how implied volatility compares across different currencies. If one currency has higher implied volatility than another, it could be an indication that traders expect it to be more volatile and therefore potentially riskier in the future.
Historical Volatility Reflects Past Trading Risk
Historical volatility is a measure of how much the price of a forex pair has fluctuated over a certain period of time and is calculated by taking the standard deviation of the prices over that time period.
Traders can use historical volatility to assess forex risk by looking at how risky a currency pair currently is compared to the past. If the historical volatility is high, then the price of a forex pair has likely been fluctuating a lot with widening trading ranges, making it riskier to trade.
A lower historical volatility reading, on the other hand, suggests that a currency pair is less volatile compared to past price action and considered less risky to trade.
In the end, regardless of the method used to measure forex volatility, they are all useful in identifying potential trading risk, so a trader can take the steps necessary to adjust their position sizes accordingly or avoid highly volatile trading conditions altogether.
Conclusion
As a trader, managing your risk properly is probably the single most important factor in trading. Volatility, on the other hand, is the market’s way of showing you how risky trading conditions are. As discussed in this article, there are various ways to measure and therefore assess forex risk.
By understanding volatility and factoring it into your risk assessment process, you’ll be in a better position to adjust your trading sizes accordingly and protect your capital.
People Also Read
- Chart Patterns Scalping Strategy
- What is the Relative Strength Index?
- Fibonacci Retracements and Projections
Forextraders' Broker of the Month
BlackBull Markets is a reliable and well-respected trading platform that provides its customers with high-quality access to a wide range of asset groups. The broker is headquartered in New Zealand which explains why it has flown under the radar for a few years but it is a great broker that is now building a global following. The BlackBull Markets site is intuitive and easy to use, making it an ideal choice for beginners.


