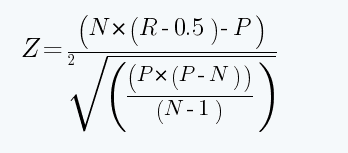
Quantitative analysis tools such as the Z-score may appear daunting at first, but devoting some time to understanding how they work can help you optimise trading returns. Z-score trading involves using a number produced by running an asset’s price data through a relatively complex formula. As with other such indicators, it is relatively easy to cut through the statistical modelling jargon to get a grasp of what the reading means. From that point on, a check of the Z-score can help determine if a trading opportunity is as good as it first appears and will help you determine what size your trading position should be.
What is the Z-Score?
The Z-score is calculated using a relatively large number of data points. They are the mean of your data set (the average raw value), the value of the data point you are considering (the raw value), and the standard deviation of all data points within the dataset (standard deviation of raw values). Diving into the mechanics of the formula can shed more light on how these factors influence the final reading.
Where:
N = total number of trades in the data sample (for example, in a string of (+++—-++—-++), we have 15 trades, and the N is 15)
R = total number of series of winning and losing streaks. If our data set has a string of (+++—-++—-++), there are five series S1(+++), S2(—), S3(++), S4(—-), S5(++). So, R is 5)
P = 2*W*L
W = total number of profitable trades in the series.
L = total number of losing trades in the series.
A series is simply an unbroken string of wins or losses. For example, (++++) is a series, as is (—), but (+-+) is not.
The key element of the formula’s design is how it aims to analyse winning and losing streaks – the R number. If we state that the above data relates to the performance of a trading strategy, then we see that over time, it posted a sequence of three winning trades, two losing ones, two winners, four losers, and finished with two more winning trades. That R number of five denotes there are five ‘series’ of trades.
Why is the Z-score R number significant? Well, consider the graphic below of two different trading models. The first has more sequences of winning and losing streaks, whereas even a visual interpretation of the data shows more of a pattern regarding performance returns.
Trading strategy 1 – Random returns
Trading strategy 2 – Greater dependence between trades
Key:
Profit
Loss
The greater the distance a negative Z-score is from zero, the more likely a winning trade will be followed by another and, as importantly, that another loss will follow a losing trade. In our example, the dependence of each outcome in Strategy 2 is greater than in Strategy 1, which helps us draw the simple conclusion that behind all the intricate calculations of the statistical model, the Z-score can simply be seen to be a useful measure of dependency.
Using the Z-Score to Determine Trade Size
Z-scores aren’t necessarily good or bad, and it is essential to consider other factors when using them. In the above example, the size of profits on winning trades in Strategy 1 may be larger than those of Strategy 2. There is less dependency, but cash returns could be larger.
Z-score can be particularly useful when money-management decisions are based on the length of each consecutive series and times when a winning or losing streak ends.
- A negative Z-score indicates greater dependency, such that profitable trades will likely be followed by more profitable trades, and losing ones will be followed by more losers. Winning or losing streaks are more probable.
- A positive Z-score means that a profitable position is likely to be followed by a losing one and vice versa. The probability of long winning and losing streaks is low.
Take, for example, a strategy with a relatively strong negative Z-score of -2.5. More capital might be applied to trading decisions directly after a sequence of losing trades is followed by a winning one. Scaling up on position size sooner rather than later could enhance your overall returns, and avoid applying extra capital just prior to the trend breaking down. There will be lower dependency and fewer clues regarding money management if your strategy’s Z-score is positive.
The size of the Z-score number also needs to be considered. The greater the distance it is from zero, the stronger the case for letting Z-score influence your capital allocation and risk-management decisions.
Calculating the Z-Score of a Trading Strategy
Running through some examples of Z-score calculations is a useful way to gain greater familiarity with the metric and revisit how it can help you determine trade size.
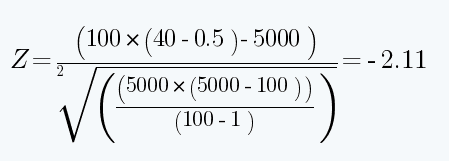
In our example, there are 100 trades with a win-loss ratio of 50/50. That’s 50 winners and 50 losers, with 40 streaks of consecutive winners or losers.
An Example Z-Score Calculation:
N = 100
P = 2 x 50 x 50 = 5,000
R = 40
The fact that the Z-score is negative suggests greater dependency and that losing trades will likely be followed by more losers, while profitable trades will likely be followed by additional profitable ones. The relatively large size of the number, -2.11, gives a strong signal that trades will probably come in streaks.
Confidence Limits
Cross-referencing our example strategy to a data table which converts Z-score into probability readings, we can say that there is a 98.21% chance that the 101st reading of the data series will depend on whether the 100th reading was positive or negative. But what exactly does that mean? If there were a 98.21% chance that the next reading would be identical to the last – that would make trading incredibly easy. Unfortunately, the 98.21% probability relates to how strong the Z-score reading is compared to other possible Z-scores. It is just a number created via a statistical formula to measure the likelihood of streaks in performance returns. While the Z-score in our example is a strong number, the chances of the next trade being the same as the last are much lower than 98.21%.
Optimising Returns Using Z-Score Position Sizing
Using another example, we can examine the hypothetical returns of two traders using two different money management strategies. Trader 1 employs a Z-score strategy in the forex markets, while Trader 1 uses a simple scaling-in method.
Trade Result | Z-Score Strategist's Action (Trader 1) | Account Change in Total | Non Z-Score Strategist's Action (Trader 2) | Account Change in Total |
+ | Buy | 10 | Buy | 10 |
+ | Buy, high Z-score suggests a string of gains | 20 | Buy | 20 |
+ | Buy | 30 | Buy | 30 |
– | Buy, Z-score tells that our losses will follow each other, exit | 20 | Buy, cut losses, exit | 20 |
– | No action | 20 | No trade | 20 |
– | Sell | 30 | Buy | 10 |
– | Sell, high Z-score suggests a string of gains | 40 | No trade | 10 |
– | Sell | 50 | No trade | 10 |
– | Sell | 60 | No trade | 10 |
+ | Sell, Z-score tells that our losses will follow each other, Exit | 50 | No trade | 10 |
+ | No action | 50 | Buy | 20 |
+ | Buy | 60 | Buy | 30 |
The (+ or -) simplify the kind of trade that would return a profit in that period. For example, if the trader gives a buy order, and the transaction is a +, or if the order is a sell, and the trade is a (-), the trader will have a profit. If the trader gives a sell order, and the trade is +, the result will be a loss.
As can be seen, the Z-score forex trader, Trader 1, has greater confidence in following up with their trades because they expect them to concatenate losses and gains. If they see a string of three gains, they are confident they can continue betting in the same direction and expect a profit.
Trader 2, who doesn’t use the Z-score, cannot decide the direction of his bets with confidence and has difficulty determining when to scale in or stop. In our example, the z-score forex trader can gain double what their competitor gains simply because they can build up their trades confidently.
Limitations of Z-score analysis
All data modelling relies on a sufficient amount of accurate and meaningful data available to be used. Z-score analysis is no different in being prone to weaknesses if data points include outliers and missing or incorrect values, which can introduce a bias into the ultimate Z-score reading. Its effectiveness is also diminished if the number of data points is too small to generate a normal distribution.
The keen-eyed will note that the Z-score considers the number and sequence of winning and losing trades and not the size of the profit or loss on each. This doesn’t mean the Z-score is ineffective in meeting its aims but does leave room for your analysis to incorporate other variables and indicators to be used in conjunction with the Z-score to give a more rounded reading.
Final Thoughts
As traders become more experienced, they learn that success is based on more than an impressive win-loss ratio – one bad trade can blow up an account and that moving away from the idea that every trade must be a winner and applying effective risk management including stop-losses, is an essential part of coming out on top overall. The Z-score forms part of that more professional approach by allowing you to identify moments when scaling up or down in position size can optimise your returns.
Related Articles:
- How to Become a Successful Forex Trader
- Money Management Articles
- What Can the Fear and Greed Index Tell Us About Forex Markets
- Forex Trading Styles
Forextraders' Broker of the Month
BlackBull Markets is a reliable and well-respected trading platform that provides its customers with high-quality access to a wide range of asset groups. The broker is headquartered in New Zealand which explains why it has flown under the radar for a few years but it is a great broker that is now building a global following. The BlackBull Markets site is intuitive and easy to use, making it an ideal choice for beginners.


