While financial market prices can be driven by a multitude of variables, it is a known fact that investor sentiment, sometimes referred to as market sentiment, can be a major force when markets begin moving significantly. How does a trader measure investor sentiment? Over the years, analysts have developed a number of ways to appraise what is going on in the minds of investors that affects buying or selling behaviour in the marketplace.
Fear and greed are powerful emotions. When trading forex it is all too easy to allow your decisions to become reactionary and be influenced by major emotions like fear and greed. There have been several attempts to capture these emotions in an indicator. The simplest one appears on most brokers’ trading screens displaying how many traders are long or short, but the most famous example is the Fear and Greed Index developed by CNNMoney.
In this article, we will discuss the CNN Fear and Greed Index in greater detail, explain how it is calculated, how it correlates with the stock market over time, and what the Fear and Greed index forex market implications are for various currency pairs in the forex market. Lastly, if you are looking for one of the best forex brokers in the industry, we present a table of the top brokers for your review, based upon our latest reviews of the forex brokerage community.
What Is the Fear and Greed Index?
CNNMoney developed its Fear and Greed Index to measure whether stocks were being valued fairly in the market and where price movements might head in the near term. The webpage on the CNN.com website updates its readings as soon as new data is made available, and its trends can telegraph the changing attitudes of investors. Traders appreciate the gauge, but stock advisors, who promote buy-and-hold stock strategies, tend to be critics as it encourages active trading.
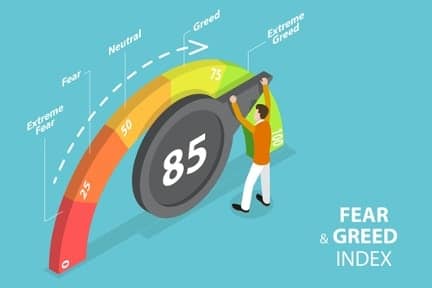
The CNN Fear and Greed Index is derived from a compilation of seven different factors in the market from volatility to actions in the options market. The data is updated as new data is released or computed, and then the result appears on a gauge from ‘0’ to ‘100’, the low value representing fear, and the high value corresponding to greed. One takeaway is that when the index hits an extreme value, stocks will either be trading much lower or much higher than their intrinsic value.
The Fear and Greed Index is designed to assess current attitudes of investors in the US stock market, but there is also a correlation with the US dollar. The correlation can range as high as 40% when both the stock market and the US dollar rise in value. Strong growth in the stock market implies that buyers abound, but in order to buy US stocks, foreign buyers will need USD, which in turn puts demand on the dollar and causes it to rise in price. The same can be said when the USD is on the rise. Investor sentiment then shifts again into stock-buying mode.
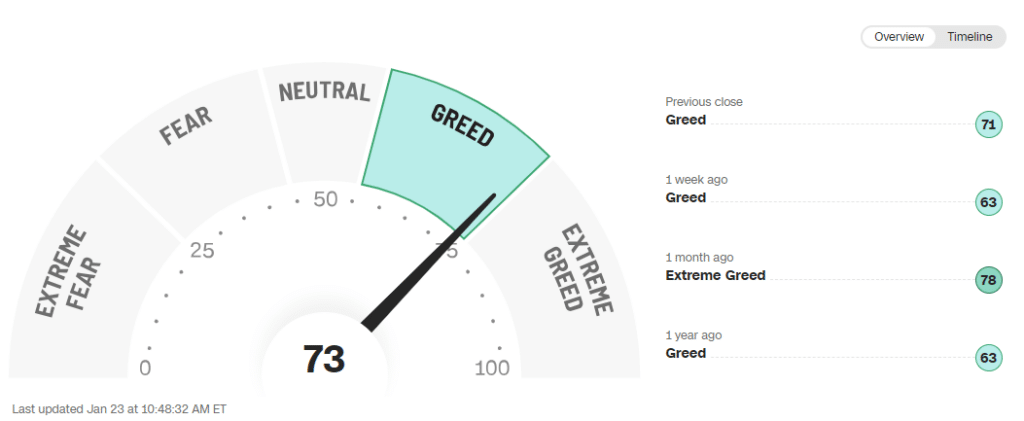
Here is the simple graphic, as it appears daily:
Graphic courtesy of CNN.com
The current value is ‘73’, well into the ‘Greed’ portion of the indicator and verging on ‘Extreme Greed’. The reading from a week ago was ’63’ – a lower score but still within the ‘Greed’ category. Values from a month and a year ago were ‘78’ and ‘63’ respectively, both also in the ‘Greed’ category.
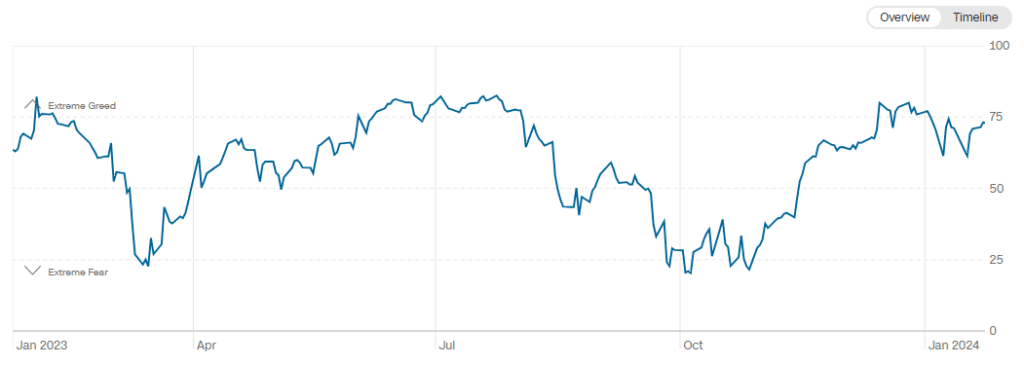
The value of the Fear and Greed index comes from plotting these readings over time and comparing them to movements in the stock market.
How Is the Fear and Greed Index Calculated?
Analysts at CNN compile data from seven different market indicators to arrive at a current reading. These seven variables are intended to reflect stock market behaviour at a point in time and are composed of the following indicators:
- Market momentum
- Stock price strength
- Stock price breadth
- Put and call options
- Junk bond demand
- Market volatility
- Safe haven demand
The computation involves average deviations from mean values, while each individual factor is weighted equally. The final outcome in the above chart was ‘73’, a score in the ‘Greed’ category. Extreme fear begins at zero, and extreme greed ends at 100. The webpage also includes individual charts over time for each of the seven factors. To observe how the index has changed over time, simply click on the ‘Timeline’ button in the top right of the graphic:
Graphic courtesy of CNN.com
There are several websites that collate this data and produce charts that compare the Fear and Greed Index values with price trends of the S&P 500, for example.
The Index values correlate roughly with price movements in the S&P 500 index. As you might expect, the emotional index tends to react more violently than stock prices, but on average, the two lines do seem to dance together. Significant changes, shown as sharp rises and declines, can forecast potential reversals in the market and give an edge to the trader, the objective in all trading venues for consistent results over the long haul.
What Can the Fear and Greed Index Tell Us About Forex Markets?
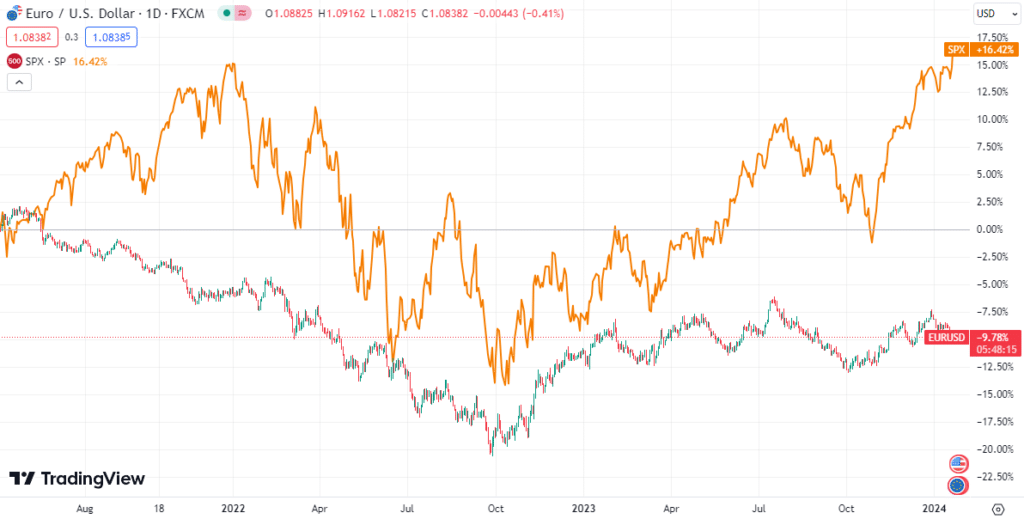
How do measures of fear and greed apply to the foreign exchange market? Our financial markets today are extremely interconnected. Emotions such as fear and greed can also move the forex market, but by how much? If you can tie the Fear and Greed Index back to stock market directions, what can this exercise suggest for potential directions of a currency pairing such as the ‘EUR/USD’? The chart below attempts to show when and where a correlation exists:
Correlation chart courtesy of TradingView.com
In the correlation chart depicted above, changes in the EUR/USD pair are plotted versus similar changes in the S&P 500 Index on a daily basis over the past year. Surprisingly, the two plots are reasonably correlated, with sharper deviations in stock prices when compared to the forex market. Note how general trend reversals for both the Fear and Greed Index in the previous chart and the S&P 500 index heralded a similar euro reversal In October.
Indicators, however, are never perfect. We can see from the above chart that the S&P 500 index and the EUR/USD pair are not perfectly in sync, but there is enough correlation to give some guidance to the trader.
Trade Forex With Our Top Brokers
If you are a newcomer to forex trading and in need of a quality broker, or if you are considering a change in your market access provider, then look no further. We continually canvass and review the forex brokerage community to determine the top brokers, based on performance records, safety and security, and industry input. Here is our latest list of the best of the best:
| Broker | Features | Regulator | Platforms | Next Step | |
|---|---|---|---|---|---|
 Your capital is at risk
Founded: 2014 Your capital is at risk
Founded: 2014 |
|
FSPR | MT4 | ||
 Your capital is at risk
Founded: 2006 Your capital is at risk
Founded: 2006Europe* CFDs ar... |
|
ASIC, FSA, FSB, MiFID | MetaTrader4, Sirix, AvaOptions, AvaTrader, Mirror Trader | ||
 Between 74-89% of CFD traders lose
Founded: 2010 Between 74-89% of CFD traders lose
Founded: 2010Between 74-89 % of retail investor accounts lose money when trading CFDs |
|
ASIC, FCA | MetaTrader 4, MetaTrader 5, cTrader | ||
 Your capital is at risk
Founded: 2009, 2015, 2017 Your capital is at risk
Founded: 2009, 2015, 2017 |
|
ASIC, CySEC, IFSC | MT4 Terminal, MT4 for Mac, Web Trader, iPhone/iPad Trader, Droid Trader, Mobile Trader, MT5 | ||
 Your capital is at risk
Founded: 2006 Your capital is at risk
Founded: 2006 |
|
CySEC, DFSA, FCA, FSB, SIA | MetaTrader4, MetaTrader5, cTrader, FxPro Edge (Beta) | ||
 Your capital is at risk
Founded: 2011 Your capital is at risk
Founded: 2011 |
|
CySEC, FSC, FSCA, MISA | MT4, MT5, OctaTrader | ||
Related Articles
- Forex Sentiment Analysis – A Beginner’s Guide
- What Is Market Sentiment in Forex?
- What Is The COT Report In Forex Trading?
Concluding Remarks
A key objective for any forex trader and any trader in our other financial markets is to gauge investor or market sentiment. This reading and the trend of its cumulative values can give us significant signals as to the direction that prices will move from a probability perspective. These signals can tilt the odds in our favour and lead to long-term success.
CNN’s Fear and Greed Index is one of the popular means for determining investor attitudes at the moment and over time. Follow its trends and those for the stock market to gain further insights on how USD currency pairings might fare in the marketplace. Anticipating the potential for market reversals can make for more effective trading strategies in the long run.
Don’t Trade Before you see this!
We consulted our team of experts and put together 10 tips to help improve your trading.
These tips could help make you a better trader – and we’re giving them away for free!
Forextraders' Broker of the Month
BlackBull Markets is a reliable and well-respected trading platform that provides its customers with high-quality access to a wide range of asset groups. The broker is headquartered in New Zealand which explains why it has flown under the radar for a few years but it is a great broker that is now building a global following. The BlackBull Markets site is intuitive and easy to use, making it an ideal choice for beginners.


