How do economists get a handle on how prices are changing in the marketplace, which could lead to inflation in the near term? The quick answer is by conducting surveys. But how do you put the results of one survey in perspective? In the US and elsewhere, different agencies within the government conduct a series of surveys, designed to measure how prices are fluctuating in a variety of sectors from both business and consumer sources.
The more prominent ones include the Wholesale Price Index (WPI), the Consumer Price Index (CPI), and the Producer Price Index (PPI). For the WPI, prices are taken for a representative basket of what are termed wholesale goods, which only involve corporations and ignore retail-level costs to consumers. Gathering prices is only part of the equation. These prices must be weighted to reflect current product flows in industry, a task that is often open for debate.
The WPI survey process is a common one around the world, but in 1978, the US Bureau of Labor Statistics (BLS) converted its WPI to a more detailed methodology, calling it the Producer Price Index or PPI. In both cases, the base-year data is continually revised to reflect more current weightings and to align with other important indices, as are the actual commodities that are included for survey purposes. The goal is to gauge effectively how current supply-and-demand forces are impacting manufacturing and construction.
The release of WPI/PPI and CPI data can impact financial markets far and wide, including all USD-related currency pair valuations. Other countries have similar economic surveys in place, which may differ slightly in methodology and use, but these results, when released, can also have an impact in the world of forex. In this article, we will provide more information about the WPI or PPI, its background and context, how it is calculated, and how it relates to other similar indices.
Related Articles
Background/Context
What is a definition for the Wholesale Price Index? The WPI attempts to forecast inflation on retail prices by measuring how overall prices are changing on goods and services supplied by manufacturers and wholesalers, both inside and outside of the US, but only to a degree. When published, the result can be expressed as a percentage change from the previous month and year. In some cases, the result also reflects the change from the base year. Analysts are continually reviewing the process and making adjustments, as deemed necessary.
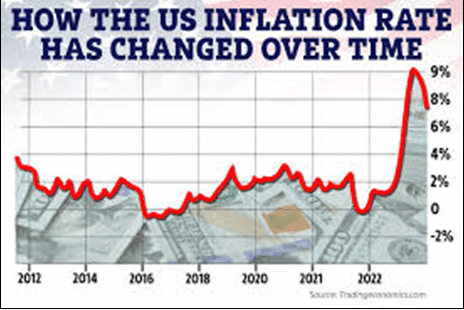
Graphic courtesy of Tradingeconomics.com
The purpose of the WPI or PPI is to be a harbinger of what to expect in the form of inflation or deflation in consumer prices by measuring price changes from the perspective of sellers. When the BLS compiles its survey data, it canvasses prices in more than 500 industry categories and for as many as 10,000 products. As depicted in the chart above, inflation on a consumer level rose dramatically during 2022, far exceeding the Federal Reserve’s target of 2%.
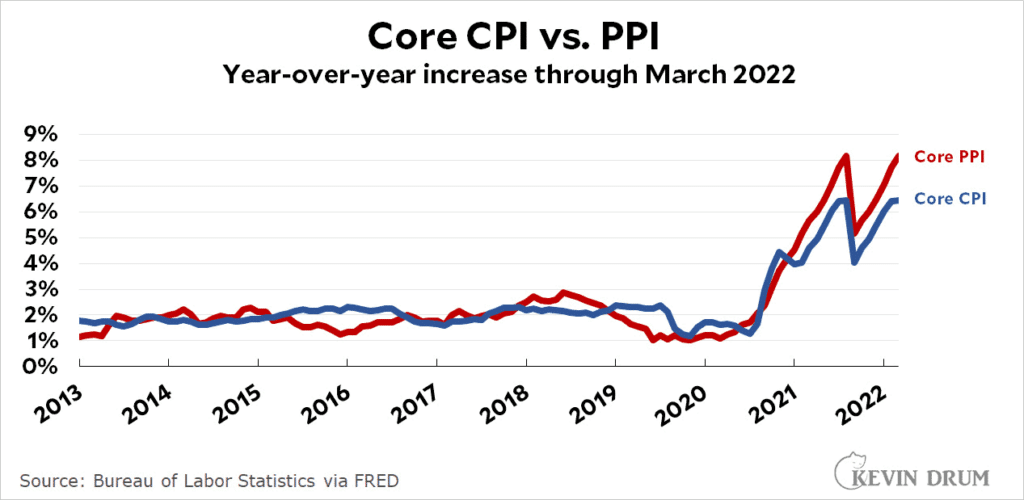
WPI data during the initial phase of the COVID-19 pandemic in 2020 actually reflected deflation, but 2021 was an entirely different matter. As can be discerned from the accompanying chart, wholesale prices from producers and manufacturers began their ascent in 2021, signalling a potential rise in consumer prices down the road. One point of clarification is that economists often address ‘Core’ CPI or PPI as a way to focus on consumer prices. The basket of goods and services is modified for this purpose.
Graphic courtesy of Kevin Drum at Jabberwocking.com
Issues arise when these measures are used for differing purposes. The PPI can be used as a measure of the health of an economy, as it tends to focus on real growth by measuring the output of producers. In the case of the CPI, however, the emphasis is on changes in the cost of living and what should be done to income and expenditures in the marketplace to combat serious inflationary trends. Central bankers will typically raise interest rates to regulate inflation.
PPI data attempts to include the entire output of goods, while also including over 70% of the value of services. It does not include the prices of imported goods, but it does monitor export prices. The CPI actually does the opposite in these two categories, a common distinction that is misunderstood by consumers who expect a similar rise in the CPI when producer prices escalate.
There can also be issues related to what is included and how various areas in the economy are weighted in the final figures for a given month. For example, the PPI does not reflect the actual rise in housing costs or rents, which can directly impact consumers. When healthcare data is weighted for the PPI, it approximates the sector’s weighting for calculations for gross domestic product (GDP) of 20%, but the CPI uses a weighting of less than 9% in its computations.
Regardless of computational and weighting differences, the PPI is a good bellwether for how prices will change in the consumer arena. Increases in costs for producers for both goods and services do eventually get passed along to consumers, but not in a direct one-for-one basis. As producer cost increases do directly impact the future profits of corporate entities with shares on a stock exchange, investors do follow PPI changes and react accordingly.
The WPI is actually one of the oldest economic measures developed by the BLS. Its origins can be traced back to resolutions adopted in the Senate as far back as 1891, but in 1978, the BLS decided to change its name to the Producer Price Index. The revision was made to exclude the impact of indirect taxes and distribution costs on the average price points paid by producers. Observers expect more changes to come since the manufacturing sector has outsourced much of its activity offshore over the past few decades.
How does the PPI (WPI) in the US differ from the CPI?
It is easy to presume that, when the PPI changes, the CPI will soon change in a similar direction and with a similar magnitude. When this eventuality does not take place, traders and consumers ask what is wrong. According to the BLS website, there are both conceptual and definitional differences in how each index is constructed and maintained. These differences can be significant when the results or portions of the results are compared against one another.
The primary goal of each index can also add to the problem. The PPI is used to measure both output and inflation/deflation price trends for sellers. The CPI is designed to reflect the impacts of inflation on the cost of living for consumers. The causes for these differences can be categorised into three critical areas: scope and coverage, categorisation, and other technical differences. Here are just a few of the ways that the PPI and CPI differ:
- Owners’ housing costs and their equivalent rental value are included in the CPI. The PPI does not include a cost for shelter as it is not a domestically produced output.
- Imports are a major portion of the CPI calculation, but the PPI excludes these items because a domestic supplier does not produce them.
- The personal consumption portion of the PPI allows for payment by third parties on behalf of consumers, primarily in the healthcare area. The CPI does not include these amounts.
- The scope for the CPI also ignores interest rates or costs. The PPI does make allowances for interest paid by producers originating from banking and insurance services.
- The US economy is a service-driven economy. About 67% of GDP is now generated by the services sector, yet the PPI includes less than three quarters of this area of activity. As a result, the CPI can differ due to rents and educational service not found in the PPI.
- There are other minor differences related to how transportation, marketing and utility costs are reflected, mainly because the CPI looks at the total amount paid by the consumer.
- The PPI excludes sales and excise taxes. The CPI includes them.
- The PPI gathers data on a single day in the month. The CPI collects data during the month.
Conclusion
Economists in government agencies around the world, along with institutions such as the World Bank, produce Wholesale Price Index data to warn of pressure on local prices, as well as to denote the health of their respective economies. Inflation is often a good thing, as long as it stays within defined limits to signify that the local economy is growing. If inflation stays around 2%, central bankers are happy, but much higher figures can send stocks into a tailspin.
Following the COVID-19 pandemic, however, prices went into decline, as economies slowed down, but now the reverse is true. Whether it is WPI or PPI data, each statistic has forewarned that inflation in the business sector was present and increasing at a rapid rate. Inflation at a consumer level has also followed. As a result, forex rates have also experienced a high level of uncertainty. Follow WPI and PPI economic releases to gain fundamental insights on long-term forex trends.
Forextraders' Broker of the Month
BlackBull Markets is a reliable and well-respected trading platform that provides its customers with high-quality access to a wide range of asset groups. The broker is headquartered in New Zealand which explains why it has flown under the radar for a few years but it is a great broker that is now building a global following. The BlackBull Markets site is intuitive and easy to use, making it an ideal choice for beginners.


