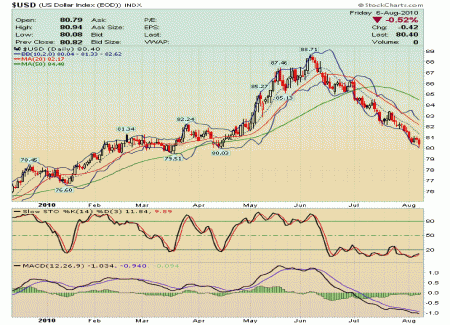
Slow Stochastic Definition. A Slow Stochastic is a technical momentum indicator from the oscillator family that consists of two lines called the %K and the %D lines. It is also a leading, rather than lagging, indicator, but its shortcoming is that it is difficult to know how long in advance the signal is appearing. The concept of this oscillator is based on observations that, as the market reaches an overbought condition, the closing prices tend to approach the daily highs. Conversely, the opposite is true in an oversold market. The %K line formula relates to these price conditions and the %D line is a modified moving average of the %K values. The “Slow” version, favored by forex traders because they believe the signals are more accurate, plots the %K using the previous %D, and %D becomes a moving average of that figure. The indicator traverses a 0 to 100 scale, with signals being generated at each extreme. One common trigger for an oversold market occurs when the %K line drops below 20, which is read as a buying signal. If the %K crests just below 100, then heads downward, the currency should be sold before that value drops below 80. Generally, if the %K value rises above the %D, then the crossover is a buy signal as long as the values are under 80. If they are above this value, the security is considered overbought. The timing fault of this indicator can be addressed by using the MACD in combination. This lagging indicator can confirm a Slow Stochastic trend direction when its lines cross. Both indicators appear on the USD Index chart below:
Forextraders' Broker of the Month
BlackBull Markets is a reliable and well-respected trading platform that provides its customers with high-quality access to a wide range of asset groups. The broker is headquartered in New Zealand which explains why it has flown under the radar for a few years but it is a great broker that is now building a global following. The BlackBull Markets site is intuitive and easy to use, making it an ideal choice for beginners.

