Candlestick charts are most technical traders’ favorite type by far, simply because they reveal more useful information visually than other charting methods. Information such as investors’ sentiment and emotions can often be determined by the candlesticks’ shape, magnitude, and colors.
Candlesticks also form repeatable patterns that occur in any market and timeframe, which in many instances can help with forecasting a market’s short-term price direction.
In this article, we will explore a popular candlestick pattern: the shooting star forex pattern, what spotting this pattern on your chart means, and how to trade it using a simple strategy.
What is the Shooting Star Forex Pattern?
Image for illustrative purposes only
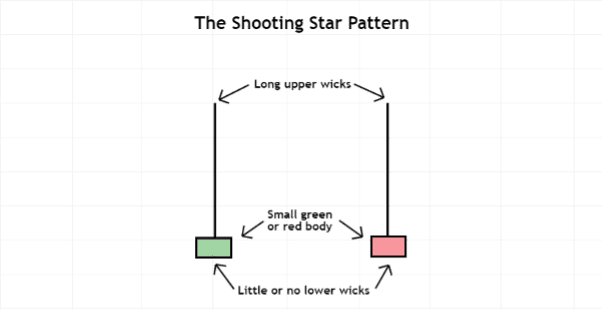
The shooting star forex pattern is a singular, bearish candlestick that can appear after an uptrend. This pattern forms when a price opens and advances substantially to the upside, then closes near the opening price again with a small green or red body, and with little or no lower wick.
There are three criteria a candlestick must have to be considered a valid shooting star:
- The pattern must form during a bullish phase.
- The distance between the candle’s opening price and highest price should be at least double the size of the shooting star’s body.
- There should be little to no lower wick.
A shooting star forex pattern is therefore a bearish reversal candlestick that generally appears after a rise in price and signals a potential change in trend direction.
What Does the Shooting Star Forex Pattern Mean?
Image for illustrative purposes only
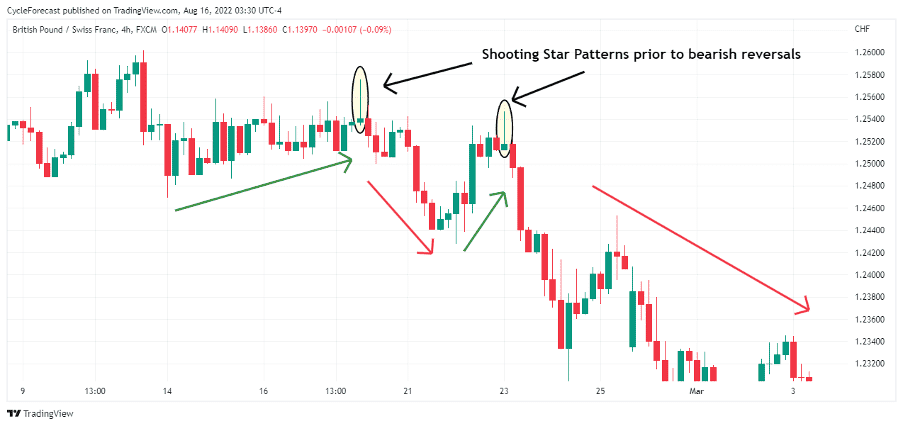
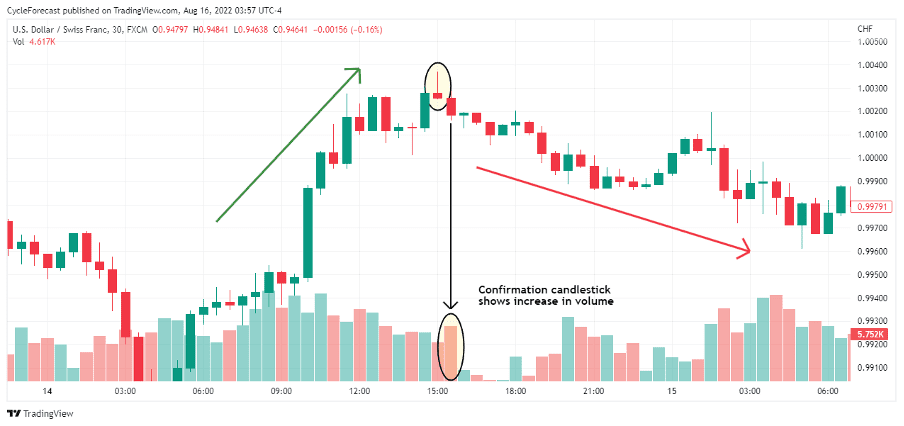
The chart above shows two examples of a shooting star forex pattern (marked with ovals) that formed right at the end of periods when price advanced higher, followed by bearish reversals.
When this pattern forms following a price advance, it indicates buyers continued pushing a price strongly higher, but sellers stepped in near the candle highs and pushed the price lower again.
The fact the shooting star forex pattern closes with a small green or red body near the candle’s opening price is a clear indication that buyers lost control and sellers took over.
The bullish momentum leading up to the shooting star forex pattern has therefore suddenly shifted to favor the bears; this could be seen as an early warning sign that price is about to reverse lower.
How to Trade the Shooting Star Forex Pattern
Image for illustrative purposes only
To trade the shooting star forex pattern, traders want to see the next candle following the pattern moving lower, and close below the shooting star’s closing price. This confirms the shooting star, but should the next candlestick move higher instead and break the shooting star candle’s high, it invalidates the pattern.
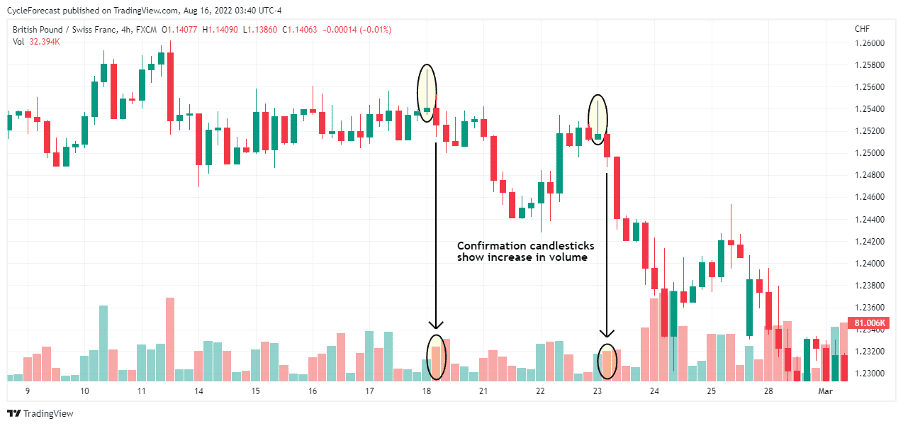
Another method that can be used to confirm that price is indeed about to move lower is the confirmation candle being accompanied by a rise in volume.
In the example above, we have added a volume indicator to the chart’s lower panel and marked the volume bars directly below the red confirmation candles with ovals. Note the volume increase directly following the shooting star candles.
Traders will often use additional technical analysis techniques such as indicators to confirm candlestick patterns, rather than relying on the patterns alone. In our proposed strategy, the volume indicator works well because it will show you whether or not sellers are indeed in control.
Image for illustrative purposes only
With additional confirmation based on the red candlestick and volume indicator, the next step in our strategy will explain how and where to place entry, stop-loss, and target orders.
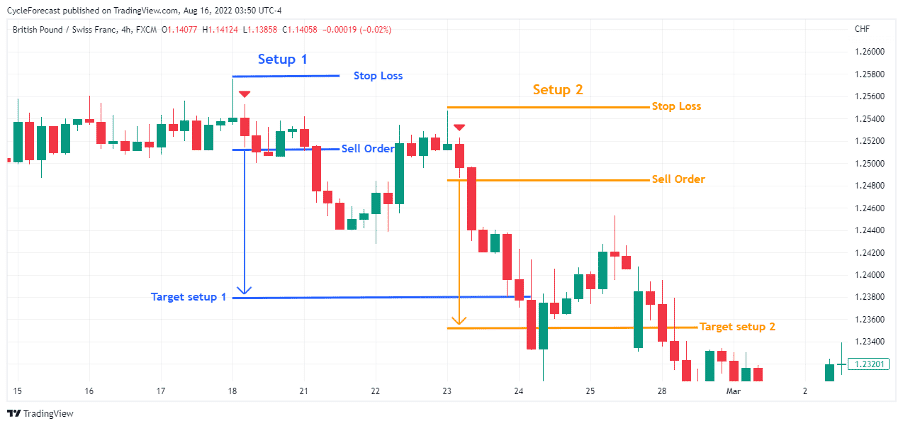
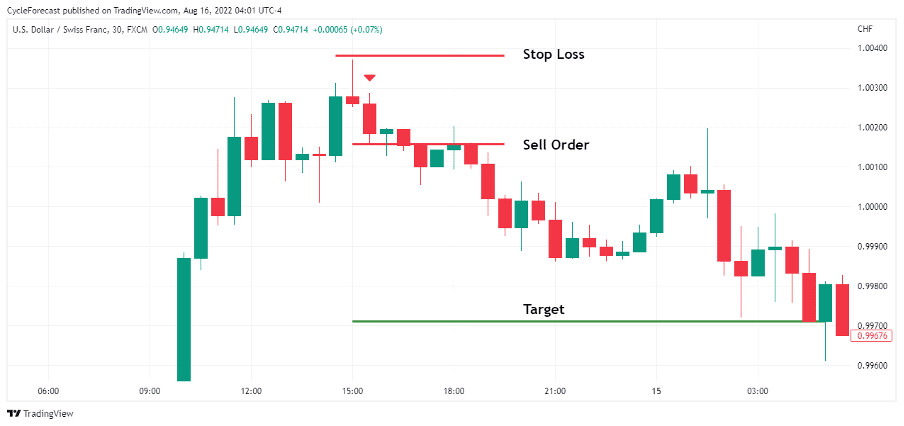
Following the trade set-up examples above, sell orders were positioned a few pips (or increments) below the red confirmation candles (marked with red arrows), and stop-loss orders were placed a few pips above the shooting star pattern’s highs.
Target orders were placed at levels that offered double the reward versus the risk taken for each trade. This is called a risk versus reward ratio, and a sensible trading strategy will always aim for a target larger than your potential risk.
Image for illustrative purposes only
Our second trade example shows a shooting star forex pattern (this time with a red body), which formed right at the high of a bullish trend before a strong reversal lower followed.
This example also shows a clear increase in volume during the formation of the red confirmation candle that followed the shooting star; this increased the odds of a highly probable bearish reversal.
Image for illustrative purposes only
Following the same entry procedure as before, a sell order was placed a few pips below the red confirmation candlestick (marked with red arrow), and a stop-loss order was positioned a few pips above the shooting star’s high.
The target order in this example was again placed at a level that offered double the reward versus the risk taken on this trade.
Conclusion
All of the above shooting star forex pattern set-ups resulted in profitable trades, however it is important to note it is best not to make trading decisions based on a single candlestick. Please be aware that trading is risky and can result in significant losses.
The additional confirmation methods explained in this article play an important role in identifying the shooting star candles that may lead to the highest probability set-ups.
Good strategies generally combine candlestick patterns with other forms of technical analysis to help traders make better-informed trading decisions.
We used the volume indicator as part of the easy-to-follow strategy proposed above, but other indicators such as the Moving Average Convergence Divergence (MACD), Relative Strength Index (RSI), and Fibonacci levels may also help with finding the best shooting star forex set-ups.
I hope this article has provided you with the knowledge you need to easily identify, confirm, and trade the popular shooting star forex pattern.
Trade Candlestick Patterns with Top Forex Brokers
| Broker | Features | Regulator | Platforms | Next Step | |
|---|---|---|---|---|---|
 Your capital is at risk
Founded: 2014 Your capital is at risk
Founded: 2014 |
|
FSPR | MT4 | ||
 Your capital is at risk
Founded: 2006 Your capital is at risk
Founded: 2006Europe* CFDs ar... |
|
ASIC, FSA, FSB, MiFID | MetaTrader4, Sirix, AvaOptions, AvaTrader, Mirror Trader | ||
 Between 74-89% of CFD traders lose
Founded: 2010 Between 74-89% of CFD traders lose
Founded: 2010Between 74-89 % of retail investor accounts lose money when trading CFDs |
|
ASIC, FCA | MetaTrader 4, MetaTrader 5, cTrader | ||
 Your capital is at risk
Founded: 2009, 2015, 2017 Your capital is at risk
Founded: 2009, 2015, 2017 |
|
ASIC, CySEC, IFSC | MT4 Terminal, MT4 for Mac, Web Trader, iPhone/iPad Trader, Droid Trader, Mobile Trader, MT5 | ||
 Your capital is at risk
Founded: 2006 Your capital is at risk
Founded: 2006 |
|
CySEC, DFSA, FCA, FSB, SIA | MetaTrader4, MetaTrader5, cTrader, FxPro Edge (Beta) | ||
 Your capital is at risk
Founded: 2011 Your capital is at risk
Founded: 2011 |
|
CySEC, FSC, FSCA, MISA | MT4, MT5, OctaTrader | ||
Forextraders' Broker of the Month
BlackBull Markets is a reliable and well-respected trading platform that provides its customers with high-quality access to a wide range of asset groups. The broker is headquartered in New Zealand which explains why it has flown under the radar for a few years but it is a great broker that is now building a global following. The BlackBull Markets site is intuitive and easy to use, making it an ideal choice for beginners.
