Candlestick charts are an invaluable tool that technical traders use to determine investor sentiment, which, in turn, can help them determine when to enter or exit trades. Candlesticks also tend to form repeatable patterns in any market and timeframe, which often forecasts a potential change in price direction.
In this article, we will explore a popular candlestick pattern – the morning star forex pattern – what it means when you spot this pattern on your chart, and how to trade it following a simple strategy.
What Is the Morning Star Forex Pattern?
Image for illustration purposes only
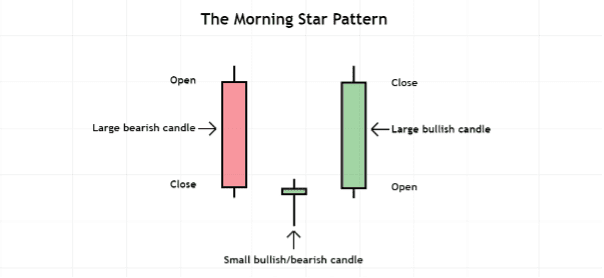
The morning star forex pattern is made up of three candlesticks. It starts off with a large red bearish candle, followed by a small bullish or bearish candle (or a doji candlestick), and then completes with a large green candlestick.
To be considered a valid morning star forex pattern, most traders want to see the third green candlestick close at least halfway up the body of the first red candlestick in the formation.
A morning star forex pattern tends to appear at the end of a downtrend or at the end of a correction within an uptrend and signals a potential bullish reversal.
What Does the Morning Star Forex Pattern Mean?
Image for illustration purposes only
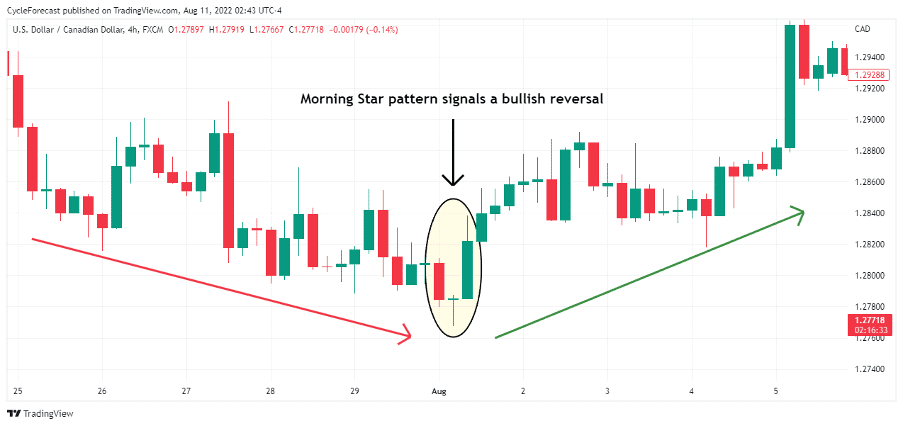
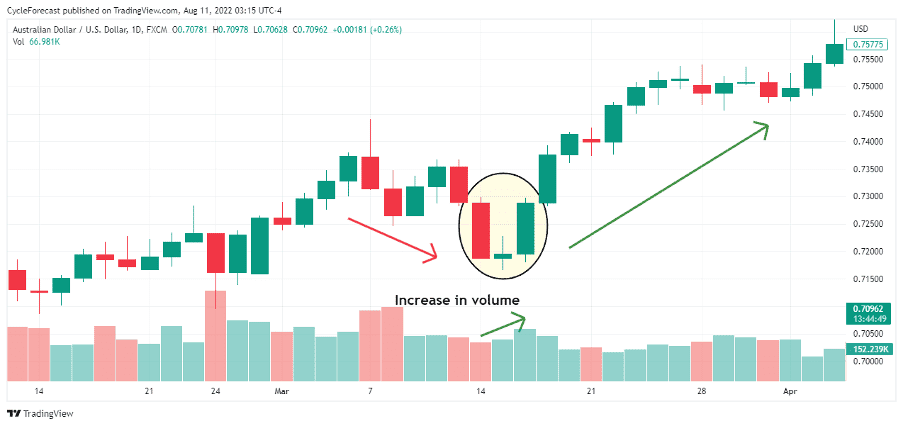
The chart example above shows a morning star forex pattern (marked by the oval) that formed right at the end of a bearish trend before a strong bullish reversal followed.
From a supply and demand perspective, the morning star pattern indicates that there was initially a lot of selling pressure during the first red candle. The second small candlestick, however, shows that there was a lot of indecision during that period, with neither the buyers nor the sellers gaining the upper hand.
The third large green candlestick that completes the pattern shows that the buyers immediately gained control of this market soon after the period of indecision, which is a strong indication that a period of rising prices is likely to follow.
Traders will often estimate the size of a potential reversal by how large the red and green candlesticks are by the time the formation completes. The larger the candles are and the higher the green candlestick moves relative to the red candlestick, the larger the potential reversal might be.
How to Trade the Morning Star Forex Pattern
Image for illustration purposes only
Before we discuss how the morning star forex pattern can be traded, we first need to introduce the volume indicator. Traders will often use additional confirmation methods, such as indicators, rather than basing their trading decisions on candlestick patterns alone.
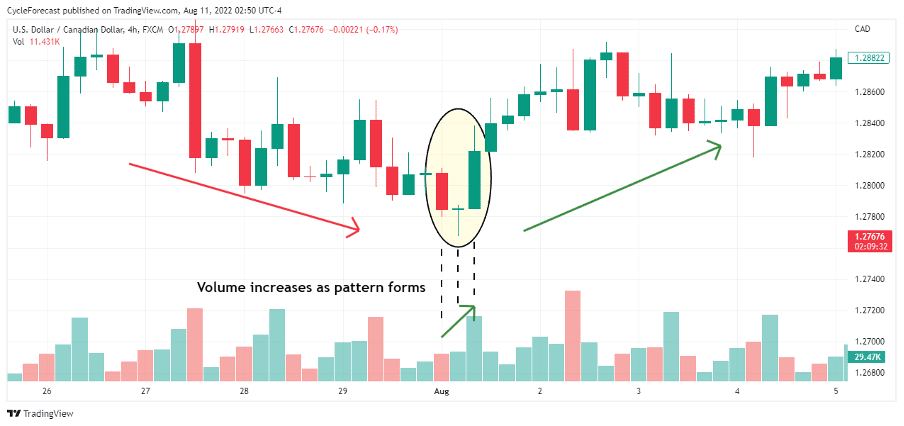
Our second chart example above shows the same morning star forex pattern as before, but this time we added the volume indicator to the lower panel of the chart.
During the formation of the three candlesticks that make up this pattern, traders want to see volume increasing with the most volume present after the close of the third green candlestick. This acts as additional confirmation that price is getting ready for a reversal.
Note how the first red candlestick showed a slight increase in volume compared to the previous candle. Then, on the second candlestick, another slight increase in volume showed, even though that candle represented a period of indecision with a small trading range.
Soon after the close of the second candle, the third candlestick changed direction to the upside, closed with a large green body, and showed a notable increase in volume.
Image for illustration purposes only
With the additional confirmation from the volume indicator after the pattern completed, traders can then proceed to placing their entry, risk and target orders.
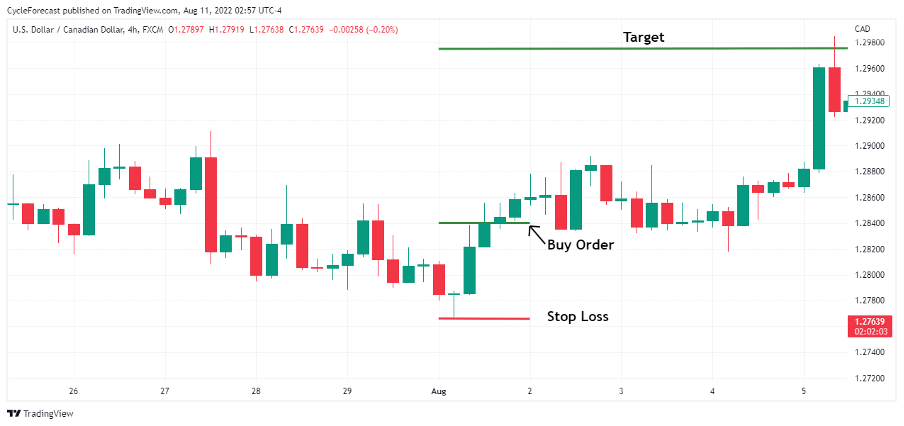
Knowing that the morning star forex pattern forecasts a potential bullish reversal, a trader can then place a buy order a few pips above the third green reversal candle and a stop-loss order a few pips below the lowest point of the pattern.
A target can be placed at a level with a profit potential double the size of the potential loss inherited in the trade. This is called the risk-reward ratio and a sensible trading strategy will always aim for a target that is larger than your potential risk.
Image for illustration purposes only
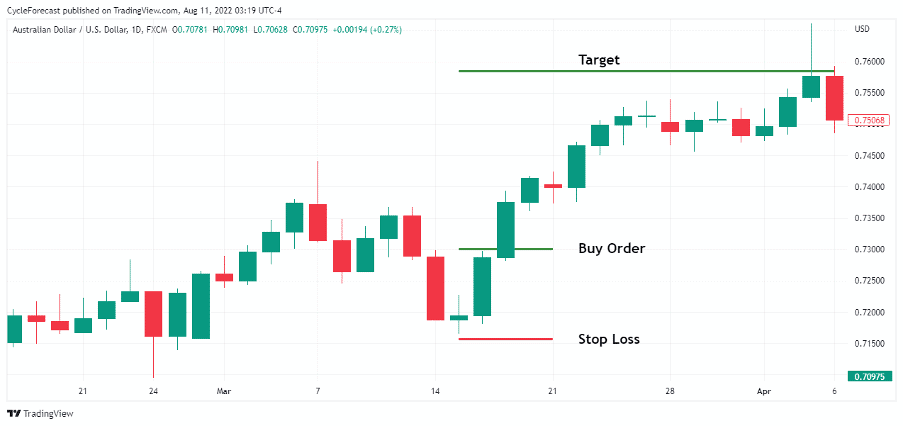
Our second trade example shows another morning star forex pattern that formed after a corrective phase within a bullish trend, but this time on a different market and timeframe.
This example also shows an increase in volume during the formation of the morning star pattern, which confirmed the pattern and increased the odds that a bullish reversal was highly probable.
Image for illustration purposes only
Following the same entry procedure as before, a buy order was placed a few pips above the green reversal candle with a stop-loss order positioned a few pips below the lowest point of the pattern formation.
This is a great example of how strong a bullish reversal can be following the morning star forex pattern, and here price reached a target level that provided double the amount of reward versus the initial risk taken on this trade.
Conclusion
The morning star forex pattern is a popular pattern that forecasts a potential bullish reversal. However, as discussed above, traders will often rely on additional analysis techniques that can help them identify the patterns that might lead to the strongest bullish reversals.
We used the volume indicator to help confirm the overall pattern and it played a crucial role in the easy-to-follow strategy that we proposed in this article.
Good strategies stack the odds of becoming consistently profitable in your favour, and they mostly focus on filtering out the bad trade setups from the ones that have the highest probability of making a profit. Please be aware that trading is risky and can result in significant losses.
Hopefully, this article provided you with the knowledge needed to easily identify, confirm and trade the popular morning star forex pattern.
Trade Candlestick Patterns with Top Forex Brokers
| Broker | Features | Regulator | Platforms | Next Step | |
|---|---|---|---|---|---|
 Your capital is at risk
Founded: 2014 Your capital is at risk
Founded: 2014 |
|
FSPR | MT4 | ||
 Your capital is at risk
Founded: 2006 Your capital is at risk
Founded: 2006Europe* CFDs ar... |
|
ASIC, FSA, FSB, MiFID | MetaTrader4, Sirix, AvaOptions, AvaTrader, Mirror Trader | ||
 Between 74-89% of CFD traders lose
Founded: 2010 Between 74-89% of CFD traders lose
Founded: 2010Between 74-89 % of retail investor accounts lose money when trading CFDs |
|
ASIC, FCA | MetaTrader 4, MetaTrader 5, cTrader | ||
 51% of eToro CFD traders lose
Founded: 2007 51% of eToro CFD traders lose
Founded: 200751% of eToro retail investor accounts lose money when trading CFDs with this provider. You should consider whether you understand how CFDs work, and whether you can afford to take the high risk of losing your money. |
|
ASIC, CySEC, FCA | eToro Platform | ||
 Your capital is at risk
Founded: 2009, 2015, 2017 Your capital is at risk
Founded: 2009, 2015, 2017 |
|
ASIC, CySEC, IFSC | MT4 Terminal, MT4 for Mac, Web Trader, iPhone/iPad Trader, Droid Trader, Mobile Trader, MT5 | ||
 Your capital is at risk
Founded: 2006 Your capital is at risk
Founded: 2006 |
|
CySEC, DFSA, FCA, FSB, SIA | MetaTrader4, MetaTrader5, cTrader, FxPro Edge (Beta) | ||
 Your capital is at risk
Founded: 2011 Your capital is at risk
Founded: 2011 |
|
CySEC, FSC, FSCA, MISA | MT4, MT5, OctaTrader | ||
Forextraders' Broker of the Month
BlackBull Markets is a reliable and well-respected trading platform that provides its customers with high-quality access to a wide range of asset groups. The broker is headquartered in New Zealand which explains why it has flown under the radar for a few years but it is a great broker that is now building a global following. The BlackBull Markets site is intuitive and easy to use, making it an ideal choice for beginners.
