Candlestick charts are by far the most popular chart type technical traders use today. They visually represent investor sentiment in a much clearer way than line bar charts would, for example.
Because candlesticks represent investors’ behavior over a certain period, they tend to form repetitive patterns that often forecast a change in price direction, or a potential trend continuation. There are many candlestick patterns that have been clearly documented; some of them go by unusual names such as ‘dark cloud cover’, ‘three black crows’, or ‘spinning top’.
In this article, we will explore a very popular candlestick pattern: the Marubozu forex pattern, what seeing it on your chart means, and how to trade it.
What is the Marubozu Forex Pattern?
Image for illustrative purposes only
‘Marubozu’ is a Japanese word meaning ‘close-cropped’, referencing a candlestick with little to no wick.
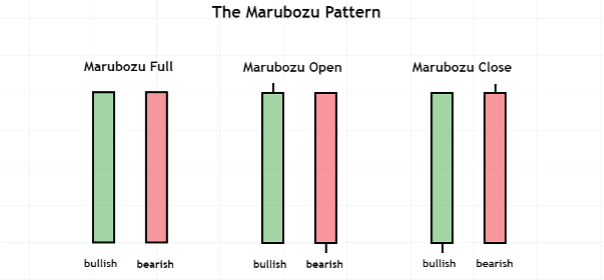
A Marubozu forex pattern can appear in both a bullish and bearish trend and comprises a single candlestick with a long body. There are three Marubozu pattern variations: the Marubozu full, Marubozu open, and Marubozu close.
When a candle closes with a long body that has no upper or lower wick, it is referred to as a Marubozu full. A Marubozu open candlestick has no wick at the opening end, but can have a small wick at the closing end. The Marubozu close candle has a small wick at the opening end, with no wick at the closing end.
What Does the Marubozu Forex Pattern Mean?
Image for illustrative purposes only
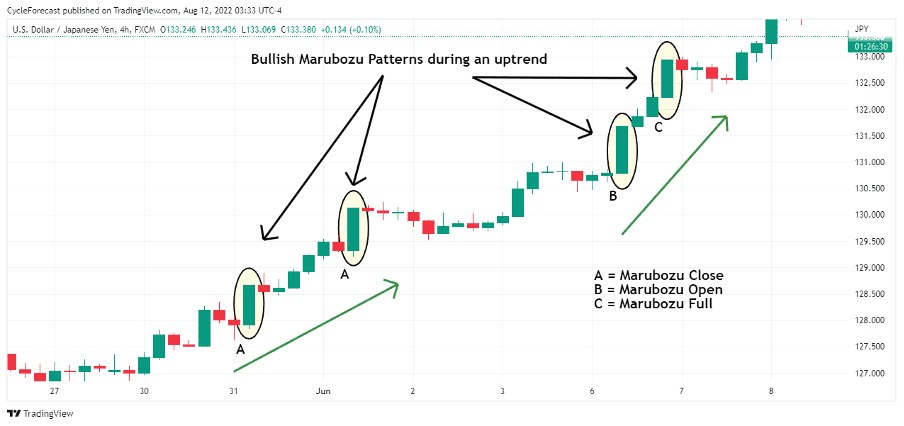
The chart example above shows four instances (with all three Marubozu pattern variations) where a bullish forex pattern formed during an uptrend.
When a bullish Marubozu forex pattern appears on a chart, it strongly indicates there is more demand than supply for a currency, which typically leads to a strong price rise.
Image for illustrative purposes only
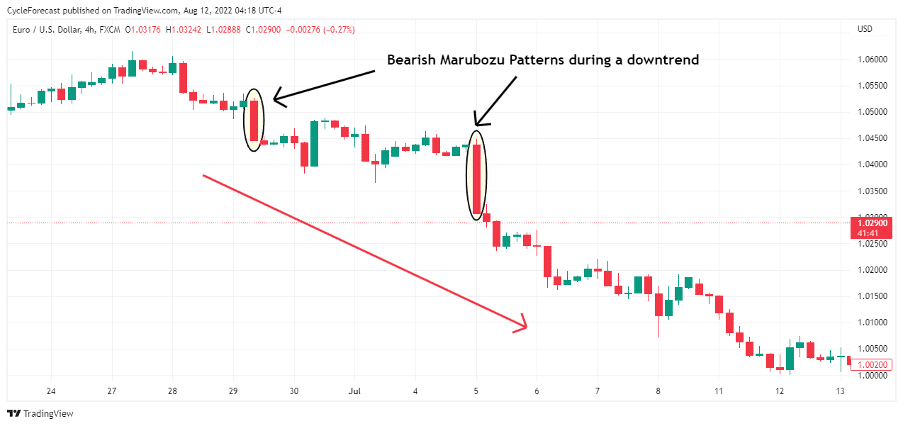
This next chart example shows two instances where bearish Marubozu close patterns appeared after periods of temporary price consolidation that led to strong price declines.
When a bearish Marubozu forex pattern forms, it is a reliable indication there is more supply than demand present in a market, and a bearish trend continuation is likely to follow.
How to Trade the Marubozu Forex Pattern
The following is a simple strategy for trading the best Marubozu forex pattern set-ups, with additional volume indicator confirmation.
Image for illustrative purposes only
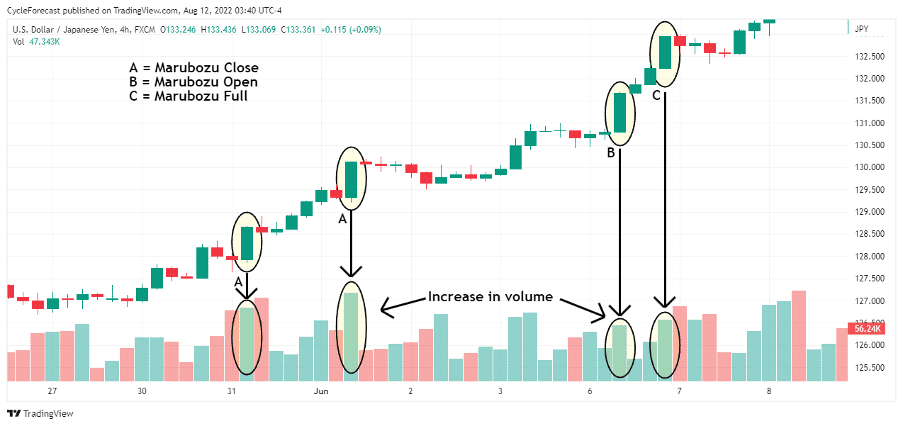
The example above shows the same bullish Marubozu patterns as before, with a volume indicator added to the chart’s lower panel. Traders will often use additional confirmation methods to trade forex candlestick patterns, rather than relying on the pattern on its own. Doing this can help traders identify the Marubozu forex patterns that may lead to the highest probability trade set-ups.
The volume indicator is a good additional confirmation method when trading the Marubozu pattern because it will clearly show you whether the Marubozu candlestick is accompanied by an increase in volume. The more volume present after a Marubozu candle closes, the better the chances the bullish momentum will continue.
Note the green bars (marked with yellow ovals on the lower chart panel) are showing a clear increase in volume — higher than the preceding candlesticks — each time a Marubozu candle formed.
In instances where a Marubozu candlestick appears without a clear increase in volume, you may be dealing with a false breakout, which may lead to a reversal that can stop out your trade position.
Image for illustrative purposes only
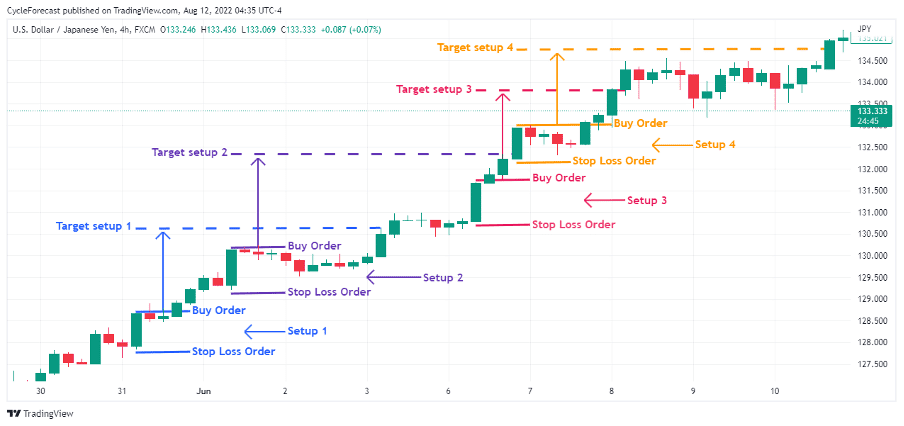
Now that we know what the Marubozu forex pattern looks like and how to apply the volume indicator as additional confirmation, we can proceed to the trade entry and order placement step of this strategy.
Once the pattern has been confirmed, a buy order can be placed a few pips (or increments) above the green Marubozu candle’s high. A stop-loss order can be placed a few pips below the same candlestick, and a target order at a level that will offer double the reward versus the risk taken on this trade.
All four of the bullish Marubozu forex patterns shown above resulted in profitable trades; this illustrates the effectiveness of this pattern when used in combination with the volume indicator. Please note that this is not guaranteed and these trades could have resulted in a loss.
Image for illustrative purposes only
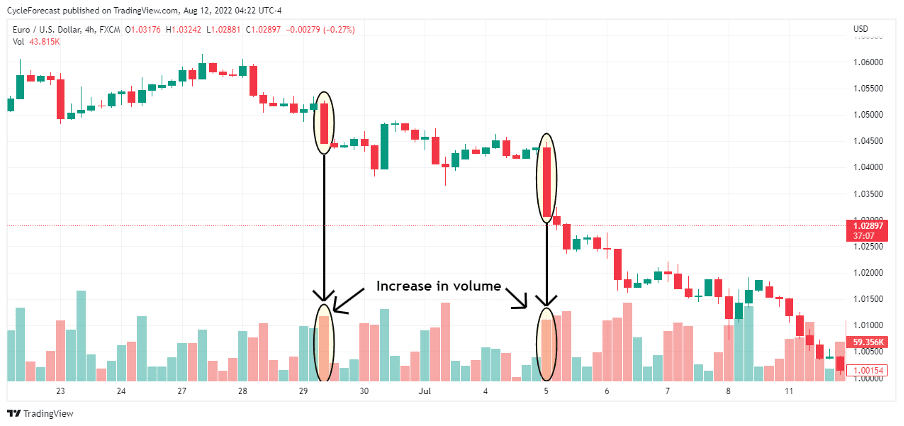
Our previous bearish Marubozu examples are above; here, too, there was a visible increase in volume after the Marubozu candles closed, which was also higher than the consolidation phase volume. This is exactly what traders want to see before they decide to place their trade orders.
Image for illustrative purposes only
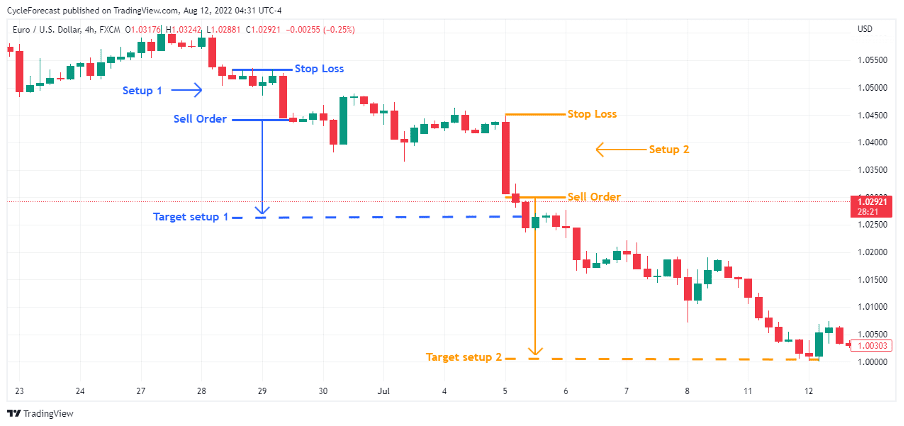
After both the bearish Marubozu forex patterns were confirmed, a sell order was placed a few pips below the red candle, and a stop-loss a few pips above it. A target order was again placed at a level that offered double the reward potential versus the risk taken on this position.
Once these bearish positions were filled, price rapidly declined, and both targets were reached in quick succession.
Conclusion
The popular Marubozu forex pattern tends to appear during a strong trending environment where either the buyers or the sellers in a market are in clear control.
In the trade examples shown above, we used the volume indicator to help us identify the Marubozu forex patterns that may generally lead to the highest probability trend continuation set-ups.
Other indicators such as the Moving Average Convergence Divergence (MACD), Relative Strength Index (RSI), or Fibonacci ratios may also be useful to confirm the best Marubozu forex pattern set-ups, but using the volume indicator with the strategy above should provide you with adequate tools and knowledge to trade this powerful candlestick forex pattern.
Trade Candlestick Patterns with Top Forex Brokers
| Broker | Features | Regulator | Platforms | Next Step | |
|---|---|---|---|---|---|
 Your capital is at risk
Founded: 2014 Your capital is at risk
Founded: 2014 |
|
FSPR | MT4 | ||
 Your capital is at risk
Founded: 2006 Your capital is at risk
Founded: 2006Europe* CFDs ar... |
|
ASIC, FSA, FSB, MiFID | MetaTrader4, Sirix, AvaOptions, AvaTrader, Mirror Trader | ||
 Between 74-89% of CFD traders lose
Founded: 2010 Between 74-89% of CFD traders lose
Founded: 2010Between 74-89 % of retail investor accounts lose money when trading CFDs |
|
ASIC, FCA | MetaTrader 4, MetaTrader 5, cTrader | ||
 51% of eToro CFD traders lose
Founded: 2007 51% of eToro CFD traders lose
Founded: 200751% of eToro retail investor accounts lose money when trading CFDs with this provider. You should consider whether you understand how CFDs work, and whether you can afford to take the high risk of losing your money. |
|
ASIC, CySEC, FCA | eToro Platform | ||
 Your capital is at risk
Founded: 2009, 2015, 2017 Your capital is at risk
Founded: 2009, 2015, 2017 |
|
ASIC, CySEC, IFSC | MT4 Terminal, MT4 for Mac, Web Trader, iPhone/iPad Trader, Droid Trader, Mobile Trader, MT5 | ||
 Your capital is at risk
Founded: 2006 Your capital is at risk
Founded: 2006 |
|
CySEC, DFSA, FCA, FSB, SIA | MetaTrader4, MetaTrader5, cTrader, FxPro Edge (Beta) | ||
 Your capital is at risk
Founded: 2011 Your capital is at risk
Founded: 2011 |
|
CySEC, FSC, FSCA, MISA | MT4, MT5, OctaTrader | ||
Forextraders' Broker of the Month
BlackBull Markets is a reliable and well-respected trading platform that provides its customers with high-quality access to a wide range of asset groups. The broker is headquartered in New Zealand which explains why it has flown under the radar for a few years but it is a great broker that is now building a global following. The BlackBull Markets site is intuitive and easy to use, making it an ideal choice for beginners.

