As we start a new quarter, the question on everyone’s mind is whether we are truly on an economic uptrend or just treading water, waiting for the inevitable downturn? The prevailing scenario has generally been that the U.S. economy will pull the rest of the world out of its lethargy. Inflation will rise; unemployment will decline; and wages will finally march upward for the workingman. There is even hope that the EU will wake up and surprise us all, but the engines of commerce in Europe seem to be stuck in neutral. The U.S., however, keeps moving along, some say at a snail’s pace, but still improving, although not at the 4%+ rates promised by Trump’s campaign rhetoric.
Read more forex trading news and forecasts
Trump supporters have been quick to grab at anything that appears positive, then to blow it up way out of proportion, choosing to ignore the preponderance of data that sings to the contrary. Are we better off, and, if we are, will the chaos that will accompany trade negotiations derail the global economy for good? Articles are beginning to surface that suggest that our financial markets are much more fragile than we think, that our current complacency is likely to be blown away by a dreaded “black swan” at a moment’s notice. The authors that pen these critiques are more worried about central bankers and their machinations. What if all began unloading bonds from their respective balance sheets?

What other worrisome thoughts are there out there regarding “black swans”, those pesky devils that, by definition, are external shocks that no model could have predicted? We have already mentioned central bank machinations. The others that float to the top relate to market sensitivity, the apparent lack of growth in wages despite favorable changes in unemployment figures, and the ever present flattening of yield curves for both U.S. Treasury and corporate bond offerings. Without increasing household income, consumer spending will wither on the vine, and flat yield curves always precede a recession.
Is the U.S. economy really doing better and can it lead us all to prosperity?
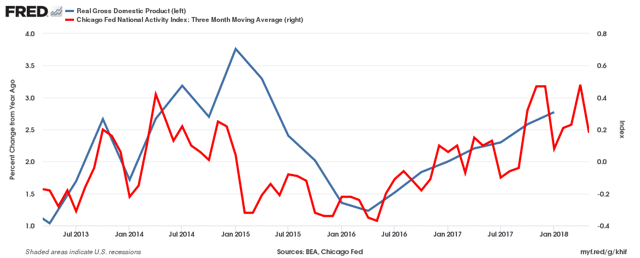
Let’s start with the basics – Is U.S. GDP growth improving? Forecasting GDP growth, as any economist will tell you, is an art form that is unfortunately dependent upon a plethora of variables. In other words, any prediction must be put in context by stating every possible caveat that could undermine the effort. The Fed, for example, always updates its forecast for future GDP growth data points, but they have invariably been off the mark. What we can do, however, is review history and any number of proprietary models that attempt to show potential future correlations. Here is just one example:
We already know that the first quarter of this year came in at 2.0%, delivering a new annual data point of 2.8% on the chart above, about where your eye would place it. The second quarter guesstimate is up for grabs. The Federal Reserve Bank of Atlanta, Trump’s favorite, had projected 4.8% two weeks back, but has gradually reduced that figure down to 3.8%. A consensus of 20 Blue Chip economists is presently at 3.5%, but the range of this austere group is anywhere in between 2.8% and 4.1%. Incidentally, a 3.5% figure would produce an annual average of 2.9%, again, about where your eye might put it, but it looks like flatter times are ahead. The new normal is slow growth.
Have Trump’s tax cuts really provided the boost expected?
Although proponents of the Trump tax cuts would like to believe that they were the genesis of an economic revival, there is nothing in the above data that would indicate that this proposition is the case. At this time, a true revival could always be in the offing down the road, but there is no indication that activity has truly been lifted to a higher plane. Yes, stocks have gone up, but even that rise has been muted, due to trade tensions. Corporate tax savings and the repatriation of profits from abroad were supposed to lead to increased domestic capital investment and wages. Neither has been the case. Corporate stock buy-backs are the rage, benefiting only the shareholders.
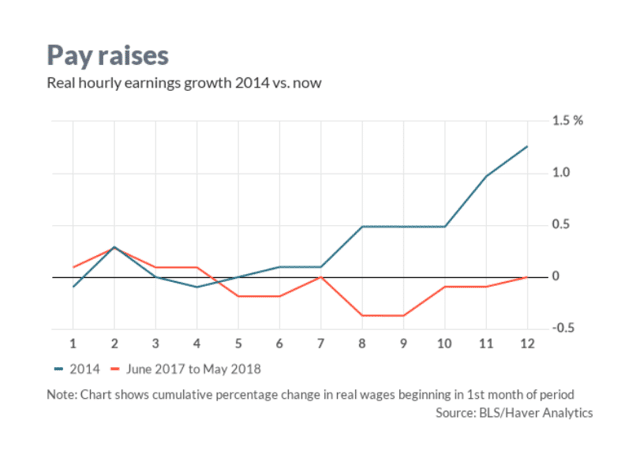
Trump’s minions may be grabbing at straws to glorify their tax cut actions, and it may be too soon to discount any boost in the future. The jury may still be out on increased capital spending, but the conundrum facing economic policy makers is that low unemployment is supposed to put pressure on wages. More household disposable income leads to more consumer spending, which is normally the case this time of year when consumers get their long-awaited tax refunds. The puzzle is that, despite Trump’s tweets to the contrary, the workingman has not benefited from his tax cuts. Increasing oil prices have offset minor tax reductions, and wages are flat once again, after having risen
nicely in 2014, as this following diagram reveals:
Will Trump’s self-inflicted trade wars really bring chaos to the markets?
As you might expect with tariff threats and trade wars looming, analysts have gone into overdrive to determine just how bad it could get. Many are coming away with the conclusion that current headline hysteria has been overblown. Even if tariffs reach the figures in the following chart, those in the know still suspect the impacts to be negligible.
Yes, there is a battle going on with China, but the consumers will pay for these tariffs in higher prices at checkout. The impact, however, is minimal, if you compare each country’s Current Account, which, as one analyst put it, “is where the crosscurrents of imports/exports and financial flows are reconciled into an overall figure.” Would you believe that the U.S. capital account is only 2.4% of overall GDP? And, for another shocker, the ratio for China is only 1.3%. Europe appears to be the one most at risk. Capital account to GDP is 3.5% in the EU. At the end of the day, the headlines may be much ado about nothing, but the perception that reality may be much worse may be enough to disrupt markets for months to come. Time will tell.
What potential “Black Swans” are really lurking in the shadows?
If tariff and trade war headlines are a distraction, then where is the real news? Concerned insiders cite three areas that could develop into the much-ballyhooed “Black Swan” or could lead to an overreaction to a single non-descript event:
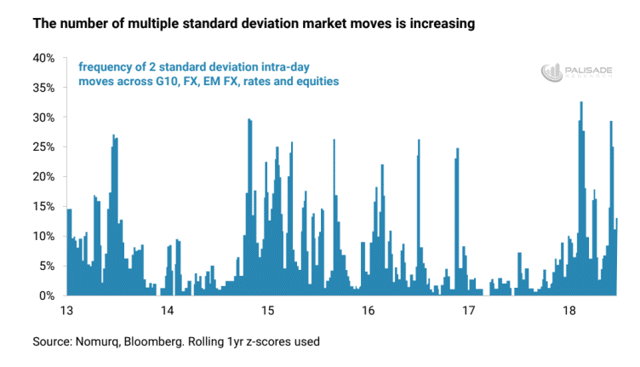
- Market Sensitivity: From the latter perspective, investors, hedge fund managers, and mere employees with 401K savings plans are edgy. Pundits have warned for years now that Armageddon is just around the corner, that financial markets are set to go into a tailspin, and that this record Bull market is ready to die at any moment. Yet it has not come to pass, but the doomsayers have only raised the volume of their rhetoric of late. This “fear” reaction can be measured by statistical methods, as depicted in the following diagram:
These measures take into account a broad mix of our international financial markets. The actions borne out by the chart are not confined to the U.S. or to any single region. What could tip the scale? What “straw” could make the camel bend a knee? Pundits point to Fed rate increases, rising oil prices, and even “falling forward earnings expectations in the latter half of 2018.” A global liquidity crunch could arise from any one of these so-called sublime situations, if the timing is off just a bit.
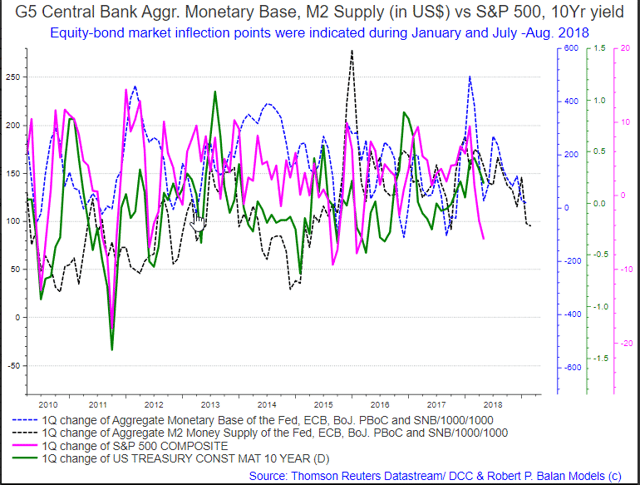
- Central Bank Machinations: Much has been written about how central banks are holding market forces hostage with various forms of QE, NIRP, and ZIRP monetary policy actions, all seemingly coordinated on an international basis. No one, however, is quite sure if there is a coordinated way to extricate ourselves from the current situation without causing significant harm to the global economy. At some point, more units than just the Fed will be normalizing their rates and balance sheets, each to its own tune, which could cause a loud discordant note amongst developed, as well as developing, economies. Emerging economies are already suffering. The following chart, though complex by nature, demonstrates that decreasing the aggregate monetary base around the globe could wreak havoc on equity markets:
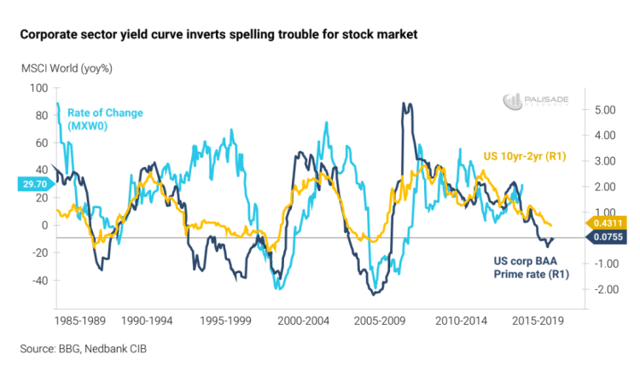
- Yield Curve Inversions: Lastly, we have the issue of flattening yield curves, the one leading indicator that we have that has consistently warned that a recession is imminent. Let’s start with a chart:
Margins between long and short-term bonds for both the U.S. Treasury and the corporate sector have been declining since 2009. While the market expects lower growth and deflation for the long-term, the Fed keeps pushing short rates up. As one analyst concluded, “The bond market’s calling the Fed’s bluff – and yields will invert sooner than later. I also need to remind you that U.S. yield curve inversion has preceded the last seven straight recessions. Making matters worse – corporate bonds are already inverting.”
Are there others? Flat wages can kill a consumer-based economy. Real estate prices could collapse when tax deductions expire. Where are the exits?
Concluding Remarks
As we begin the second half of 2018, investors, always a worrying lot, continue to question everything, every position in their portfolio, every forecast of GDP growth, and especially whether the central banking crowd really knows what they are doing or have done to the global economy. Like it or not, our individual economies are more entwined and interdependent than every before in our history. We are in uncharted territory when it comes to predicting how any event could impact the next quarter, let alone year.
Except for a brief spate of volatility in February, markets have been relatively calm, a bit jittery mind you, but the S&P 500 index, our best proxy for measuring the health of our global economy, did dip in that same month, but soon recovered. Valuations this year, however, have been treading water, confined within tight range boundaries. I am reminded of the words of the late economist, Hyman Minsky: “A prolonged period of low volatility is the breeding ground for extreme future volatility.”
We have had two years of calm. Can a disastrous spike happen again without warning? One analyst likens the present complacency to, “Investors are back to picking up nickels and dimes in front of a steam roller.” Now may be the right time to assess your current positions, to re-think your present strategy for the next quarter and possibly year, and to be prepared for what volatility might bring in the way of opportunities.
To be forewarned is to be forearmed!
Are you ready to trade?
Sign up with 61% of eToro CFD traders lose

 Between 74-89% of CFD traders lose
  Your capital is at risk
  Your capital is at risk
  Your capital is at risk