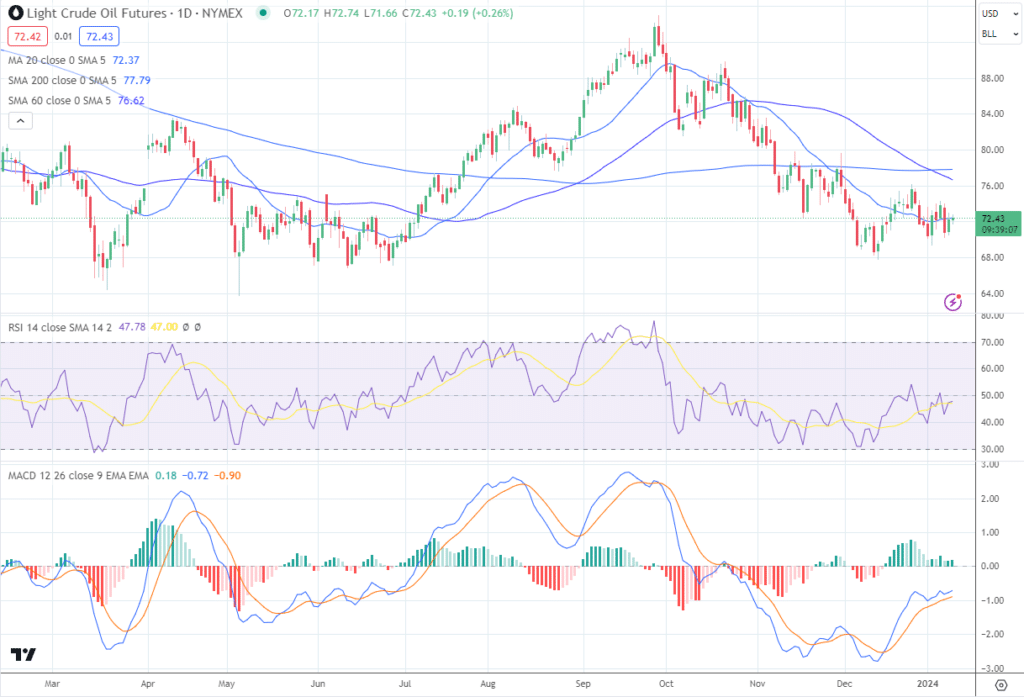
Oil prices are moving sideways (see chart below) following a runup in the spring of 2023 and a decline during Q2 2023. The sideways price action reflects the market absorbing new information as it bumps along the recent lowest levels seen during the past 12 months.
Prices faced headwinds in early January 2024, as Saudi Arabia announced that it would cut prices for crude oil expected to be exported to Asia. Additionally, OPEC output rose by 70,000 barrels daily, creating additional headwinds for oil prices. Oil prices are also facing tailwinds as geopolitical risks continue to buoy prices, especially after Middle Eastern attacks escalated following attacks by Yemen’s Houthis on oil tankers in the Red Sea. The choppy nature of price action shows there are likely opportunities for oil prices to either push higher or move lower based on supply disruptions or decreasing demand.
What drives the oil demand?
A variety of factors drive oil demand. Economic activity drives the overall oil demand, particularly in transportation, manufacturing, and construction. When economic growth is strong, there is typically an increased need for energy, leading to higher oil demand.
The transportation sector is among the most significant oil consumers, especially for road transportation, aviation, and shipping. The level of economic and population growth, commuting patterns, and travel trends heavily influence oil demand within this sector.
Oil is used in numerous industrial and manufacturing processes, including producing chemicals, plastics, fertilisers, and asphalt. The demand for oil in the sectors is tied to economic growth and industrial output levels.
Oil is a crucial feedstock for the petrochemical industry, which produces a wide range of products, including plastics, synthetic fibres, rubber, and solvents. The demand for petrochemical products influences the oil demand.
Oil demand can fluctuate seasonally. For example, colder weather in winter means heating oil consumption increases, while warmer summers may drive higher demand for petrol and aviation fuel due to increased travel and holiday activities.
International trade heavily relies on the transportation of goods, which involves oil for shipping and logistics. Increased globalisation and international economic activities have affected oil demand for the movement of goods and services worldwide.
Government policies and regulations that impact energy consumption, vehicle efficiency, and environmental standards can influence oil demand. For instance, incentives for electric vehicles or renewable energy sources may reduce the reliance on oil products over time.
Political stability, conflicts, and developments in oil-producing regions can affect oil prices and supply chain dynamics, which can, in turn, influence global oil demand.
Movements in the Dollar Can Impact Oil Prices
A stronger dollar can impact oil prices in several ways. Oil is priced in US dollars on global markets. When the value of the US dollar strengthens against other currencies, it means that it takes fewer dollars to purchase the same amount of oil. As a result, oil prices in the dollar tend to decrease, making it relatively cheaper for buyers who use other currencies. This scenario can potentially reduce oil demand, leading to lower prices.
A stronger US dollar can make investing in crude oil more expensive for countries whose currencies have weakened against the dollar. This situation can reduce those countries’ purchasing power and curb their oil demand, putting downward pressure on oil prices.
Oil is a widely traded commodity, and currency movements can influence investor sentiment and speculation in commodity markets. Increased strength in the US dollar can prompt investors to shift away from oil into other assets denominated in dollars, potentially leading to lower oil prices.
A stronger dollar can indirectly impact oil prices by affecting production costs. Many oil-producing countries have weaker local currencies than the US dollar. If their currencies weaken further against the dollar, it can increase the cost of oil production as expenses such as labour, equipment, and imported materials become relatively more expensive. This situation can put upward pressure on oil prices, as producers may need higher prices to maintain profitability.
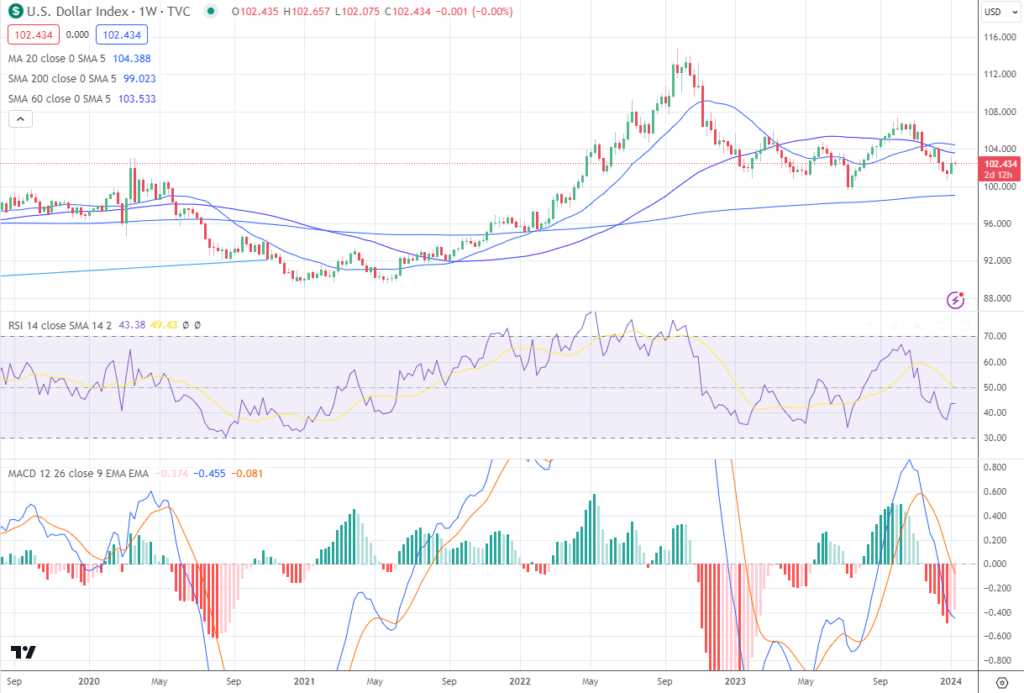
The dollar index has been on a wild ride throughout 2023, and at the beginning of 2024, the greenback has returned to levels seen at the beginning of 2023. Unsurprisingly, the price action has been similar for crude oil prices. The dollar has mainly moved lower due to declining US interest rates.
Do Lower Interest Rates Buoy Oil Demand
Lower interest rates can potentially have an indirect impact on oil demand in several ways.
Lowering interest rates stimulates economic activity by making borrowing less costly. This situation can increase consumer spending, investment, and overall economic growth. Demand for various goods and services, including oil, rises when an economy expands.
Lower interest rates can reduce the cost of financing for businesses in the oil industry. This scenario can make it more affordable for companies to invest in exploration, production, and infrastructure development. Increased investment in the oil sector can potentially lead to higher production and, consequently, increased oil demand.
Lower interest rates can sometimes contribute to inflationary pressures. Inflation can erode the purchasing power of money, leading to increased production costs and potentially higher energy demand. Oil is a significant input in various production processes, so inflation could indirectly drive oil demand.
The most recent data from the Energy Information Administration shows that total refined product demand from oil is up 0.6% yearly. Most of the increase is due to a rise in petrol consumption, up by 2.7% yearly. According to the EIA, Distillate demand is down by 1.5% yearly, and jet fuel demand is up by 2.1% yearly.
Demand from the US Government
Another factor that is helping to keep prices buoyed and in a sideways price pattern is the potential for the US government to fill the Strategic Petroleum Reserve. The SPR is a reserve of crude oil a country’s government maintains, typically for use in emergencies or to stabilise energy markets. The SPR can alleviate supply disruptions caused by natural disasters, geopolitical conflicts, significant oil production reductions and transportation problems.
The size and management of each country’s SPR can vary. The United States, for example, maintains one of the largest SPRs globally, storing crude oil in underground salt caverns along the Gulf Coast. Other countries, such as Japan, China, and India, also have strategic reserves.
The purpose of the SPR is to provide a buffer against oil supply disruptions, stabilise energy markets, and ensure that essential energy supplies are available during crises. By releasing oil from the SPR during periods of significant disruption, governments can help mitigate potential shortages and volatility in oil prices.
After drawing it down, the Biden administration refills the SPR to help ease gasoline prices. In 2022, the Administration sold 180m barrels from the SPR during a 6-month period to control fuel prices in the wake of the attack by Russia on Ukraine. As of early January 2024, the Administration has repurchased approximately 14m barrels of crude oil. The Administration had previously announced that it plans to continue to purchase oil and place it into the SPR when WTI crude oil prices reach levels between $67 and $72. With only 14m of the 180m repurchased, the US government has placed an artificial floor under the oil price.
What Strategies Can Be Employed in a Sideways Market
One way to trade oil prices as they move sideways is to look for periods of robust risk reward while prices try to find a direction. One common approach to a sideways market is to use a mean reverting trading strategy.
A mean reversion trading strategy is based on the idea that asset prices oscillate around their average or mean value over time. The strategy assumes that if the price of an asset deviates significantly from its mean, there is a tendency for it to revert towards that mean eventually.
In a mean reversion trading strategy, traders typically identify potential buying or selling opportunities based on deviations from the mean. When the price of an asset has moved significantly above its mean, indicating an overbought condition, traders may consider selling or shorting the asset, expecting it to return to its average level eventually. Conversely, when the price has dropped significantly below the mean, indicating an oversold condition, traders may look for buying opportunities, anticipating that the price will revert to its average.
Mean reversion strategies often use technical indicators or statistical measures to identify potential mean levels and deviations. Traders may use indicators such as Bollinger Bands, moving averages, or standard deviation to determine when an asset deviates from its average and identify potential entry or exit points. A Bollinger Bands trading strategy is a popular technical analysis approach traders use to identify possible price reversals or volatility in financial markets. Bollinger Bands are constructed using a statistical measure called standard deviation, which quantifies the price volatility.
The Bottom Line
The upshot is that the sideways price movement of oil represents opportunities to trade it. If you believe the US government will continue to purchase oil between $67 and $72, then those levels allow you to buy oil within this range and sell it as it moves back to the top of the range near $76.


 Between 74-89% of CFD traders lose
  Your capital is at risk
  Your capital is at risk
  Your capital is at risk