- Markets stall after Fed announces 50 basis point rate hike
- Jerome Powell is managing expectations, but forex prices might not remain stable for long.
- Wedge pattern forming in US Dollar (DXY)
Wednesday’s interest rate announcement by Jerome Powell left markets pretty much where they were before the 50-basis point rate hike was announced. Powell and his team at the US Federal Reserve might take that as a sign of a ‘job well done’; after all, their priority is market stability. But the price patterns forming point to the market taking a turn of one sort or another in the near future.
Powell Meets Market Expectations
US interest rates are now at the highest level for 15 years, and further increases are still in the pipeline. Powell’s team pushed the overnight borrowing rate to a new target level of 4.25% – 4.50% and identified 5.1% as a likely future target.
Further guidance reduced the likelihood of interest rate cuts in 2023, with a softening of policy now apparently only likely in 2024. Keeping to his tried and tested approach of saying what analysts expect of him, Powell, in his post-meeting conference, reiterated that the economic situation could still deteriorate. He said:
“Inflation data received so far for October and November show a welcome reduction in the monthly pace of price increases… But it will take substantially more evidence to have confidence that inflation is on a sustained downward path.”
Wedge Patterns Forming in Forex Markets
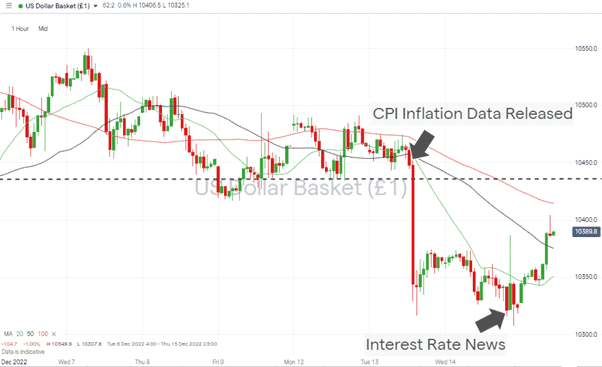
Unsurprisingly forex markets flip-flopped on the news. Immediately after the announcement, the dollar lost ground against other major currencies but then rallied. The small size of the moves is as interesting as the direction. Wednesday’s intraday low in the US Dollar Basket index (DXY) was 103.07, and the market closing price was 103.23.
US Dollar Basket index – Hourly Price Chart 2022 – US Fed Rate News
Source: IG
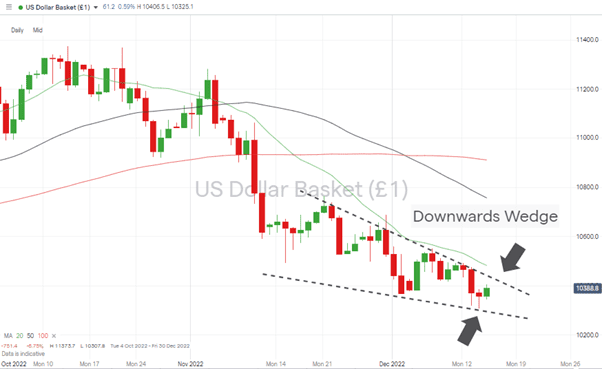
That muted reaction leaves forex markets trading inside wedge patterns and traders asking which way price will break out of those. The answer to that question may come sooner than expected.
The DXY price chart has key support levels at 103.07, Wednesday’s low, and 102.85, the region of the supporting trendline. Factor in the importance of ‘round number’ price levels, and 103.00 looks like a crucial support level.
Upward price moves have the upper trend line of the price channel to contend with, currently in the region of 104.25. Still, the key metric appears to be the 20 SMA on the Daily Price Chart, which has acted as resistance since 4th November, a close above that line opening the door to another dollar rally.
US Dollar Basket index – Daily Price Chart 2022 – Downwards Wedge
Source: IG
If you have been the victim of a scam, suspect fraudulent behaviour, or want to know more about this topic, please contact us at [email protected]


 Between 74-89% of CFD traders lose
  Your capital is at risk
  77% of CFD traders lose
  Your capital is at risk
  Your capital is at risk